Goal 1: Enhancing Educational Excellence
Increase the number, quality and diversity of students graduating from the UT System and benefiting from its distinct educational portfolio to produce at each campus and institute the most capable and best-prepared workforce for society.
Evaluation Criteria
Initiatives
- Raise the UT System’s academic quality, stature and impact through educational excellence and student achievement across diverse populations.
- Drive educational excellence and student performance and ensure a “best in class” student population.
- Establish a System mechanism to ensure campus/institute accountability for faculty quality and productivity.
- Develop and coordinate collaborative and innovative academic programs that build on the unique capabilities of the System’s campuses and institutes and drive key outcomes and standards.
Goal 1. Enhancing Educational Excellence
Enrollment
UT Student Enrollment by Campus
| Definition |
Data Source |
| Student headcount as of the official fall semester census date (14th class day) for students enrolled in credit-bearing classes—excludes students enrolled in continuing education, extension, co-op, and auditing classes only. |
THEC Student Information Data Files |
Back to top »
UT Graduate Medical Education Residents/Fellows and Certificates (Completed Residencies)
| Definition |
Data Source |
| The number of health related post doctoral trainees (residents/fellows) and certifications (completed residencies) in the Accreditation Council for Graduate Medical Education (e.g., post Doctoral Surgeons, Cardiologists, Orthodontists, ICU Pharmacists, Advanced Rehabilitation Physical Therapists, etc.). Residency education is the period of clinical education in a medical specialty that follows graduation from medical school, and prepares physicians for the independent practice of medicine. |
UT Health Science Center |
Back to top »
Goal 1. Enhancing Educational Excellence
Enrollment
Percentage of Out-of-state/International Undergraduates
| Definition |
Data Source |
| Student headcount as of the official fall semester census date (14th class day) for students enrolled in credit-bearing classes—excludes students enrolled in continuing education, extension, co-op, and auditing classes only. |
THEC Student Information Data Files |
Back to top »
Goal 1. Enhancing Educational Excellence
Student Diversity
Percentage of UT Students at Each Campus by Level, Gender, and Ethnicity
| Definition |
Data Source |
| Gender statistics based on the official fall semester census file (14th class day) |
THEC Student Information Data Files |
| Diversity statistics based on the official fall semester census file (14th class day). Minority enrollment includes African American, Hispanic, Native American Indian, Asian, and multiracial. Data prior to 2009 not comparable, due to changes in federal reporting requirements. |
THEC Student Information Data Files |
Back to top »
Goal 1. Enhancing Educational Excellence
Degrees Awarded
UT Degrees Awarded
| Definition |
Data Source |
| Total number of bachelor's degrees awarded in academic year (summer, fall, spring terms). Students receiving one degree in two fields (e.g., BA in English and BA in Spanish) are counted twice. |
THEC Student Information Data Files |
| Total number of master's and education specialist degrees awarded in academic year (summer, fall, spring terms). Students receiving one degree in two fields (e.g., MA in English and MA in Spanish) are counted twice. |
THEC Student Information Data Files |
| Total number of doctoral degrees awarded in academic year (summer, fall, spring terms). Students receiving one degree in two fields (e.g., Ph.D in English and Ph.D in Spanish) are counted twice. |
THEC Student Information Data Files |
| Total number of professional degrees (e.g., Law, Medicine, Vet Med, Pharmacy) awarded in academic year (summer, fall, spring terms). Students receiving one degree in two fields (e.g., Ph.D. in English and Ph.D. in Spanish) are counted twice. |
THEC Student Information Data Files |
Back to top »
Goal 1. Enhancing Educational Excellence
Retention and Graduation Rates
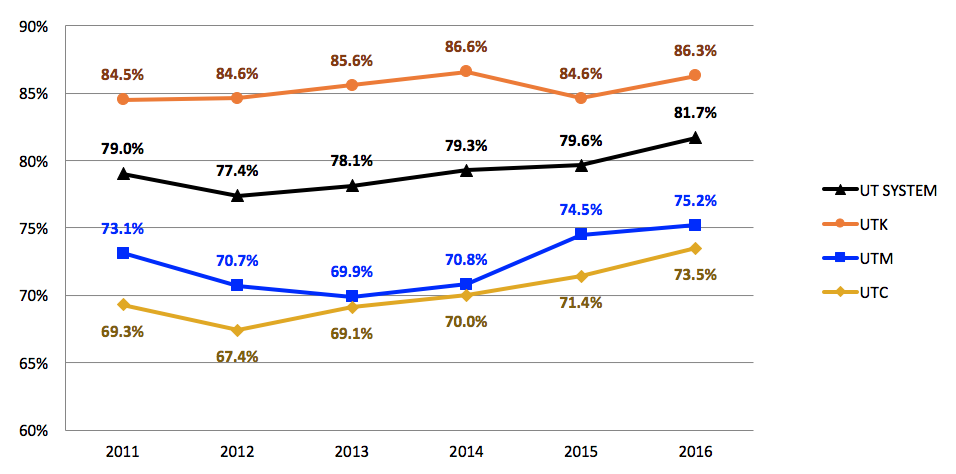
First-Year Freshmen Retention Rate
Freshman retention rates have risen significantly at UT Martin and UT Chattanooga since 2011. Systemwide, the freshman retention rate has increased almost three percentage points.
| |
2011 |
2012 |
2013 |
2014 |
2015 |
2016 |
| UT System |
79.0% |
77.4% |
78.1% |
79.3% |
79.6% |
81.7% |
| UT Knoxville |
84.5% |
84.6% |
85.6% |
86.6% |
84.6% |
86.3% |
| UT Chattanooga |
69.3% |
67.4% |
69.1% |
70.0% |
71.4% |
73.5% |
| UT Martin |
73.1% |
70.7% |
69.9% |
70.8% |
74.5% |
75.2% |
| Definition |
Data Source |
| Percent of first-time, full-time, degree-seeking college freshmen who continue to their second year (fall to fall retention rate). Fall freshmen cohort includes those who started in the Summer term. |
Consortium for Student Retention Data Exchange (CSRDE) Survey |
Back to top »
Goal 1. Enhancing Educational Excellence
Retention and Graduation Rates
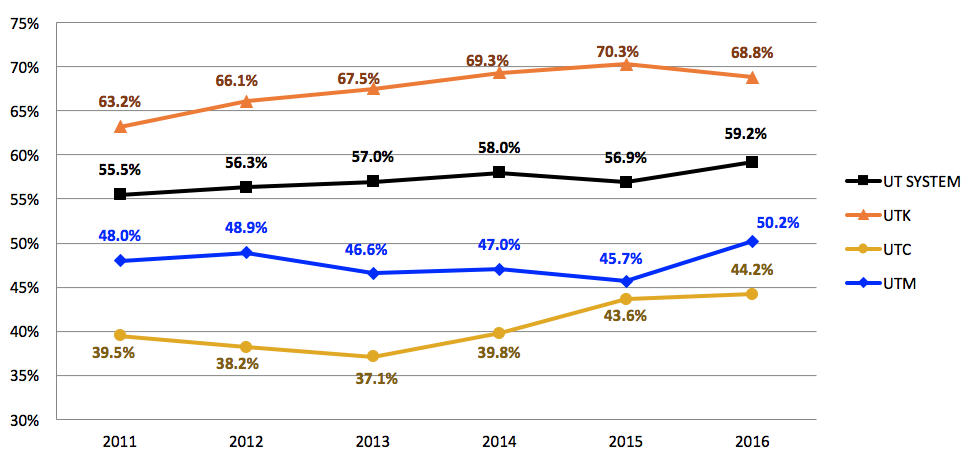
Six-Year Graduation Rate For New Freshmen
Over the past six years, the six-year graduation rates have increased at all campuses. Systemwide, the six-year graduation rate has increased by about four percentage points.
| |
2011 |
2012 |
2013 |
2014 |
2015 |
2016 |
| UT System |
55.5% |
56.3% |
57.0% |
58.0% |
56.9% |
59.2% |
| UT Knoxville |
63.2% |
66.1% |
67.5% |
69.3% |
70.3% |
68.8% |
| UT Chattanooga |
39.5% |
38.2% |
37.1% |
39.8% |
43.6% |
44.2% |
| UT Martin |
48.0% |
48.9% |
46.6% |
47.0% |
45.7% |
50.2% |
| Definition |
Data Source |
| Percent of first-time, full-time, degree-seeking college freshmen who graduate in six years (e.g., 2010 rate= % of Fall 2004 new freshmen who received a baccalaureate degree by end of Summer 2010). Fall freshmen cohort includes those who started in the Summer term. |
Consortium for Student Retention Data Exchange (CSRDE) Survey |
Back to top »
Goal 1. Enhancing Educational Excellence
Retention and Graduation Rates
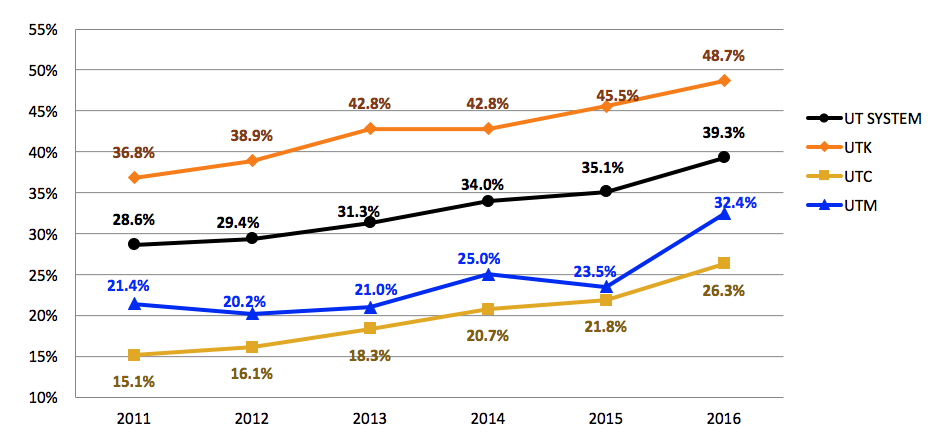
Four-Year Graduation Rate for New Freshmen
The 4-year graduation rate for new entering freshmen has significantly increased at all campuses. Systemwide, the 4-year graduation rate has increased by 11 percentage points.
| |
2011 |
2012 |
2013 |
2014 |
2015 |
2016 |
| UT System |
28.6% |
29.4% |
31.3% |
34.0% |
35.1% |
39.3% |
| UT Knoxville |
36.8% |
38.9% |
42.8% |
42.8% |
45.5% |
48.7% |
| UT Chattanooga |
15.1% |
16.1% |
18.3% |
20.7% |
21.8% |
26.3% |
| UT Martin |
21.4% |
20.2% |
21.0% |
25.0% |
23.5% |
32.4% |
| Definition |
Data Source |
| Percent of first-time, full-time, degree-seeking college freshmen who graduate in four years (e.g., 2010 rate= % of Fall 2004 new freshmen who received a baccalaureate degree by end of Summer 2008). Fall freshmen cohort includes those who started in the Summer term. |
Consortium for Student Retention Data Exchange (CSRDE) Survey |
Back to top »
Goal 1. Enhancing Educational Excellence
Student Quality
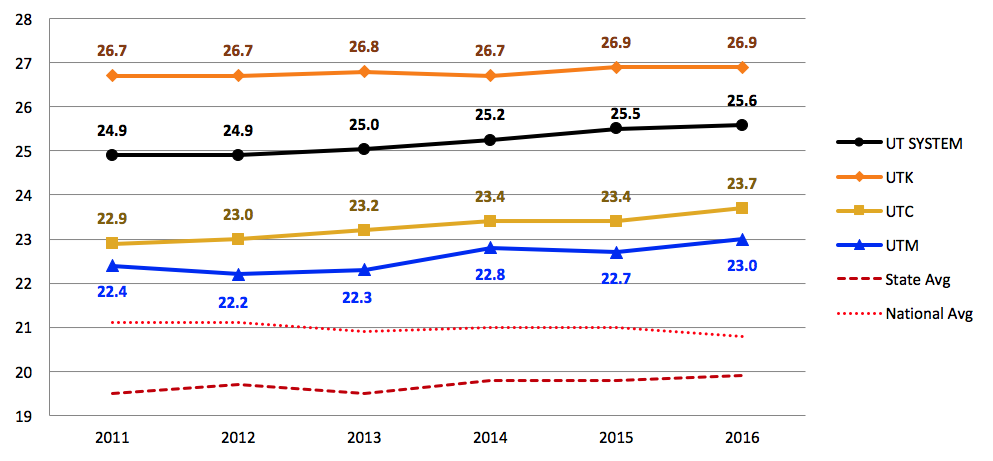
Average ACT Score for New UT Entering Freshmen
Since 2011, Freshman ACT scores have increased on all campuses. Systemwide, scores have increased by more than 2%.
| |
2011 |
2012 |
2013 |
2014 |
2015 |
2016 |
| UT System |
24.9 |
24.9 |
25.0 |
25.2 |
25.5 |
25.6 |
| UT Knoxville |
26.7 |
26.7 |
26.8 |
26.7 |
26.9 |
26.9 |
| UT Chattanooga |
22.9 |
23.0 |
23.2 |
23.4 |
23.4 |
23.7 |
| UT Martin |
22.4 |
22.2 |
22.3 |
22.8 |
22.7 |
23.0 |
| State Average |
19.5 |
19.7 |
19.5 |
19.8 |
19.8 |
19.9 |
| National Average |
21.1 |
21.1 |
20.9 |
21.0 |
21.0 |
20.8 |
| Definition |
Data Source |
| Average ACT Composite score for new fall entering freshman. |
THEC Student Information Data Files |
Back to top »
Goal 1. Enhancing Educational Excellence
Student Quality
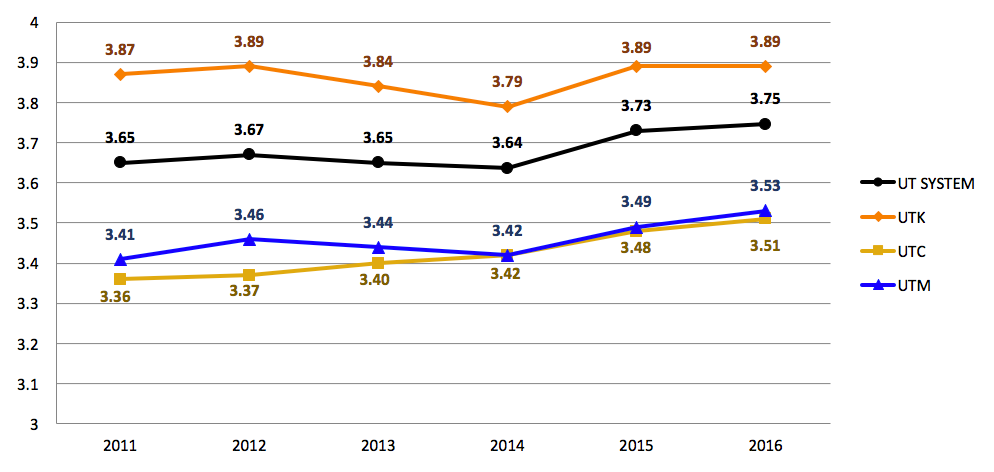
Average Weighted High School GPA for new UT Entering Freshmen
Average high school GPA has increased system wide over the past six years, with significant increases at UTC and UTM.
| |
2011 |
2012 |
2013 |
2014 |
2015 |
2016 |
| UT System |
3.65 |
3.67 |
3.65 |
3.64 |
3.73 |
3.75 |
| UT Knoxville |
3.87 |
3.89 |
3.84 |
3.79 |
3.89 |
3.89 |
| UT Chattanooga |
3.36 |
3.37 |
3.40 |
3.42 |
3.48 |
3.51 |
| UT Martin |
3.41 |
3.46 |
3.44 |
3.42 |
3.49 |
3.53 |
| Definition |
Data Source |
| Average weighted high school GPA for new fall entering freshman. A grade of "A" is 4.0; "B" is 3.0; etc. If a student receives an "A" grade in an Honors or Advanced Placement class, the grade is equal to 5.0. |
THEC Student Information Data Files |
Back to top »
Goal 1. Enhancing Educational Excellence
Student Quality
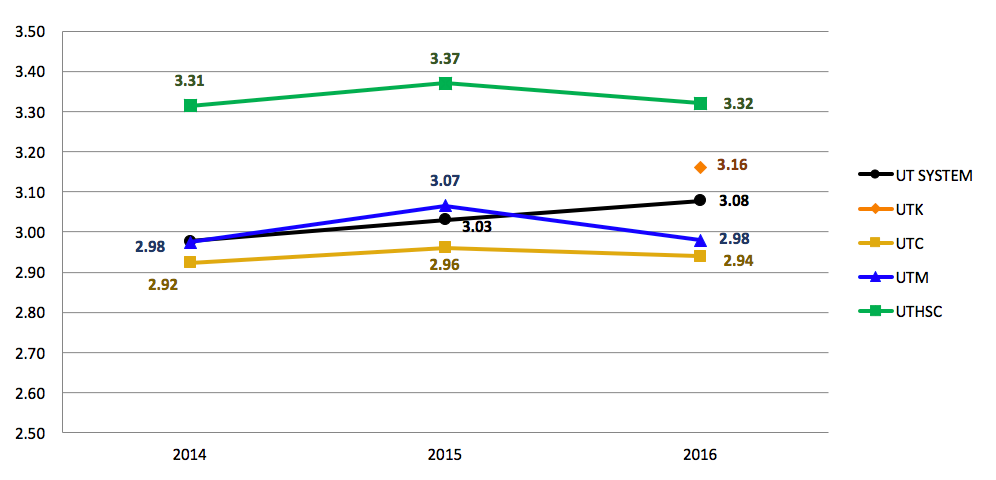
Average GPA for new UT Entering Transfer Students
Systemwide, the transfering school GPA has increased since 2014.
| |
2011 |
2012 |
2013 |
2014 |
2015 |
2016 |
| UT System |
– |
– |
– |
2.98 |
3.03 |
3.08 |
| UT Knoxville |
– |
– |
– |
0.00 |
0.00 |
3.16 |
| UT Chattanooga |
– |
– |
– |
2.92 |
2.96 |
2.94 |
| UT Martin |
– |
– |
– |
2.98 |
3.07 |
2.98 |
| UT Health Science Center |
– |
– |
– |
3.31 |
3.39 |
3.32 |
| Definition |
Data Source |
| Average weighted high school GPA for new fall entering freshman. A grade of "A" is 4.0; "B" is 3.0; etc. |
Student Information System, Extended Data Set |
Back to top »
Goal 1. Enhancing Educational Excellence
Faculty Workload
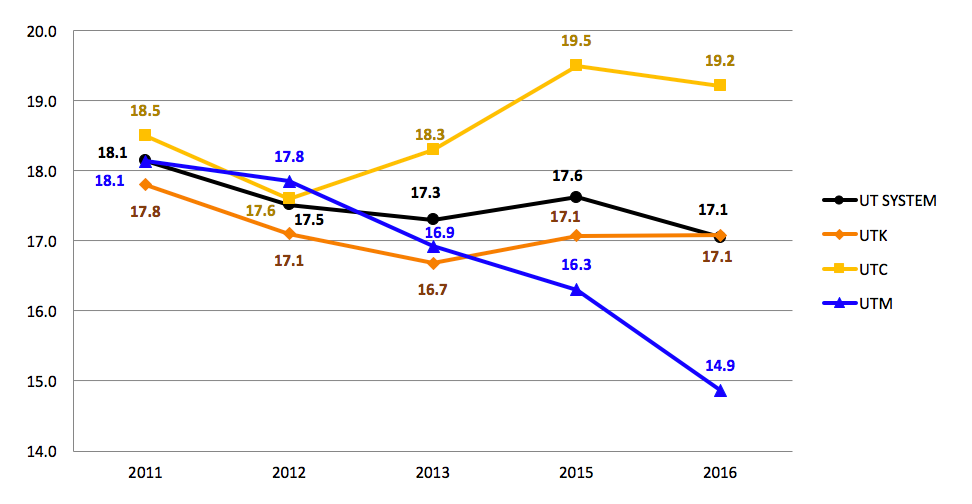
Student to Faculty FTE Ratio
Since 2011, the Student to Facultly FTE ratio has decreased at UTM and UTK but increased at UT Chattanooga.
| |
2011 |
2012 |
2013 |
2014 |
2015 |
2016 |
| UT System |
18.1 |
17.5 |
17.3 |
17.2 |
17.6 |
17.1 |
| UT Knoxville |
17.8 |
17.1 |
16.7 |
16.7 |
17.1 |
17.1 |
| UT Chattanooga |
18.5 |
17.6 |
18.3 |
18.3 |
19.5 |
19.2 |
| UT Martin |
18.1 |
17.8 |
16.9 |
16.7 |
16.3 |
14.9 |
| Definition |
Data Source |
| Fall Undergraduate Student full-time equivalent (FTE) divided by Fall faculty FTE. Faculty FTE excludes faculty in stand-along graduate or professional programs. This ratio is used for U.S.News and World Report rankings. |
Campus Common Data Set Reports |
Back to top »
Goal 1. Enhancing Educational Excellence
Faculty
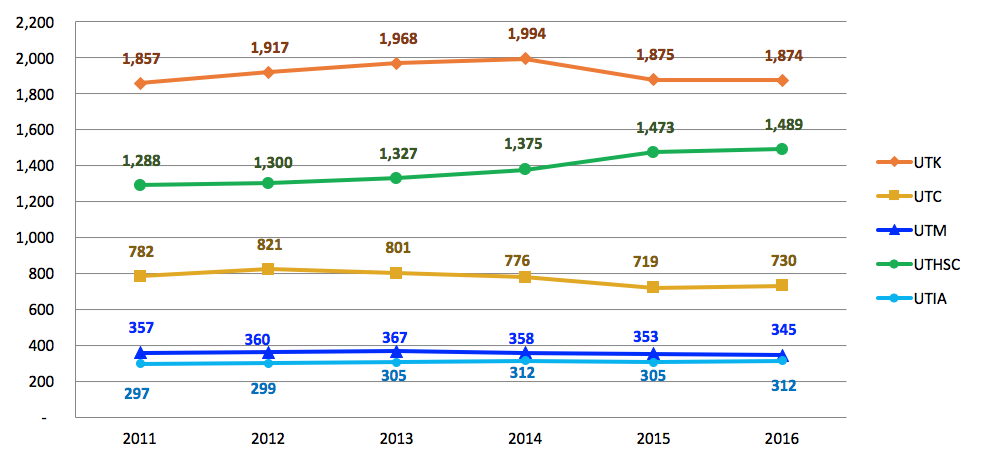
Total Number of UT Faculty
Systemwide, the total number of faculty has increased about 5%. UTHSC had the highest increase of 16% .
| |
2011 |
2012 |
2013 |
2014 |
2015 |
2016 |
| UT System Total |
4,420 |
4,529 |
4,591 |
4,635 |
4,613 |
4,632 |
| UT Knoxville |
1,857 |
1,917 |
1,968 |
1,994 |
1,875 |
1,874 |
| UT Chattanooga |
782 |
821 |
801 |
776 |
719 |
730 |
| UT Martin |
357 |
360 |
367 |
358 |
353 |
345 |
| UT Health Science Center |
1,288 |
1,300 |
1,327 |
1,375 |
1,473 |
1,489 |
| UT Institute of Agriculture |
297 |
299 |
305 |
312 |
305 |
312 |
| Definition |
Data Source |
| The total number of paid faculty whose primary appointment is listed as 'Faculty' as of Nov. 1. UT Knoxville faculty include faculty in the Space Institute and faculty in the College of Agricultural Sciences and Natural Resources (CASNR) with joint appointment with the Institute of Agriculture. UT System numbers are unduplicated. |
IRIS Human Resource Business Warehouse Report |
Back to top »
Goal 1. Enhancing Educational Excellence
Faculty
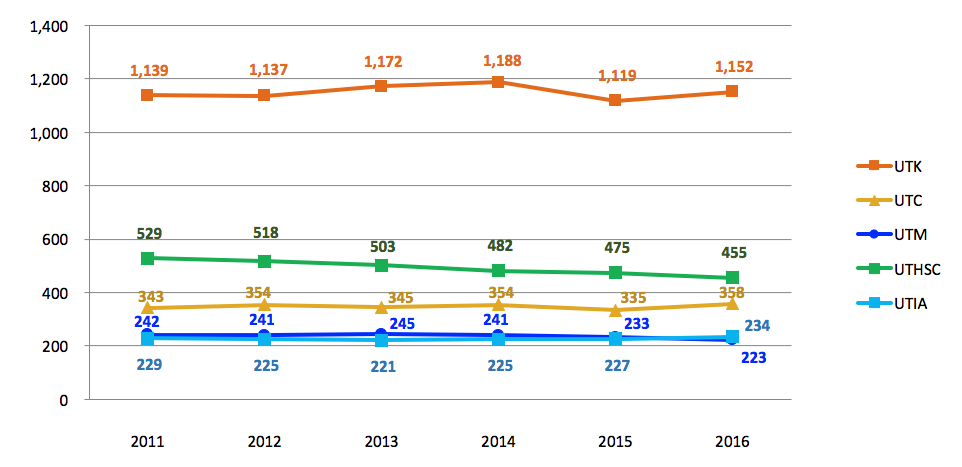
Number of Tenure/Tenure-Track UT Faculty
The total number of tenure/tenure-track faculty has remained relatively steady except for UTHSC which decreased by 14% over the last six years.
| |
2011 |
2012 |
2013 |
2014 |
2015 |
2016 |
| UT System Total |
2,330 |
2,323 |
2,341 |
2,334 |
2,287 |
2,315 |
| UT Knoxville |
1,139 |
1,137 |
1,172 |
1,188 |
1,119 |
1,152 |
| UT Chattanooga |
343 |
354 |
345 |
354 |
335 |
358 |
| UT Martin |
242 |
241 |
245 |
241 |
233 |
223 |
| UT Health Science Center |
529 |
518 |
503 |
482 |
475 |
455 |
| UT Institute of Agriculture |
229 |
225 |
221 |
225 |
227 |
234 |
| Definition |
Data Source |
| Number of paid faculty as of Nov. 1 who have received tenure or are on the tenure-track. UT Knoxville faculty include faculty in the Space Institute and faculty in the College of Agricultural Sciences and Natural Resources (CASNR) with joint appointment with the Institute of Agriculture. |
IRIS Human Resource Business Warehouse Report |
Back to top »
Goal 1. Enhancing Educational Excellence
Faculty
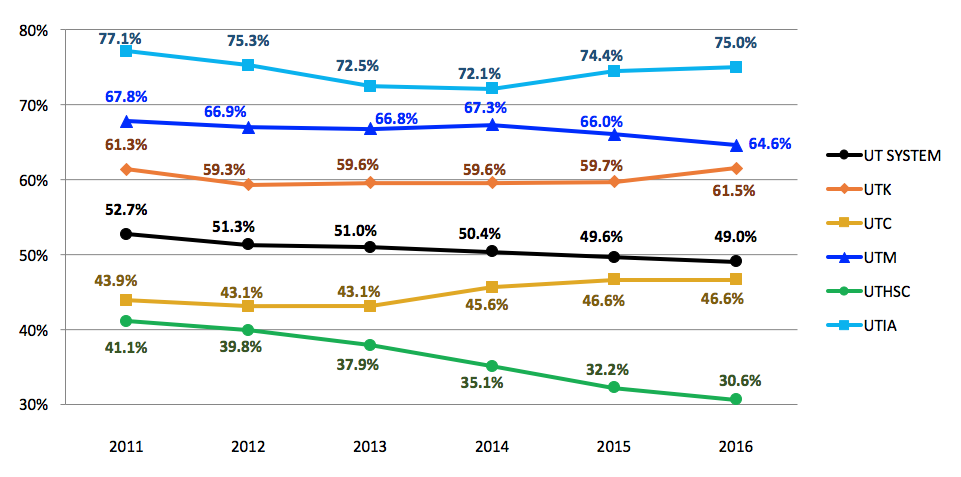
Percentage of UT Faculty with Tenure or on Tenure Track
Over the last 6 years, the percentage of the total paid faculty that are tenured or on the tenure track has declined at UTHSC, UTM, UTIA and increased at UTC.
| |
2011 |
2012 |
2013 |
2014 |
2015 |
2016 |
| UT System |
52.7% |
51.3% |
51.0% |
50.4% |
49.6% |
49.0% |
| UT Knoxville |
61.3% |
59.3% |
59.6% |
59.6% |
59.7% |
61.5% |
| UT Chattanooga |
43.9% |
43.1% |
43.1% |
45.6% |
46.6% |
46.6% |
| UT Martin |
67.8% |
66.9% |
66.8% |
67.3% |
66.0% |
64.6% |
| UT Health Science Center |
41.1% |
39.8% |
37.9% |
35.1% |
32.2% |
30.6% |
| UT Institute of Agriculture |
77.1% |
75.3% |
72.5% |
72.1% |
74.4% |
75.0% |
| Definition |
Data Source |
| Percentage of paid faculty as of Nov. 1, who are tenured or on the tenure-track. |
IRIS Human Resource Business Warehouse Report |
Back to top »
Goal 1. Enhancing Educational Excellence
Faculty
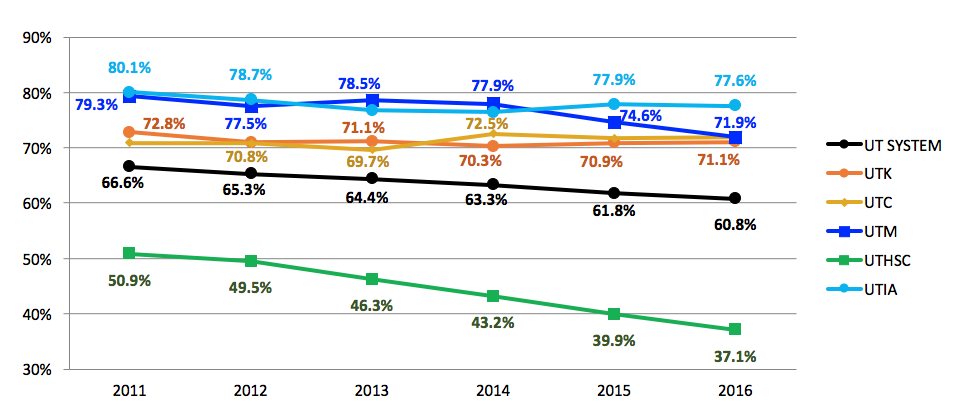
Percentage of UT Full-Time Faculty that are Tenured or on Tenure Track
Systemwide, the percentage of the full-time faculty that are tenured or on the tenure-track has declined by about 6% over the last 6 years.
| |
2011 |
2012 |
2013 |
2014 |
2015 |
2016 |
| UT System |
66.6% |
65.3% |
64.4% |
63.3% |
61.8% |
60.8% |
| UT Knoxville |
72.8% |
71.0% |
71.1% |
70.3% |
70.9% |
71.1% |
| UT Chattanooga |
70.9% |
70.8% |
69.7% |
72.5% |
71.7% |
71.9% |
| UT Martin |
79.3% |
77.5% |
78.5% |
77.9% |
74.6% |
71.9% |
| UT Health Science Center |
50.9% |
49.5% |
46.3% |
43.2% |
39.9% |
37.1% |
| UT Institute of Agriculture |
80.1% |
78.7% |
76.7% |
76.5% |
77.9% |
77.6% |
| Definition |
Data Source |
| Percentage of paid faculty as of Nov. 1, who are tenured or on the tenure-track. |
IRIS Human Resource Business Warehouse Report |
Back to top »
Goal 1. Enhancing Educational Excellence
Faculty
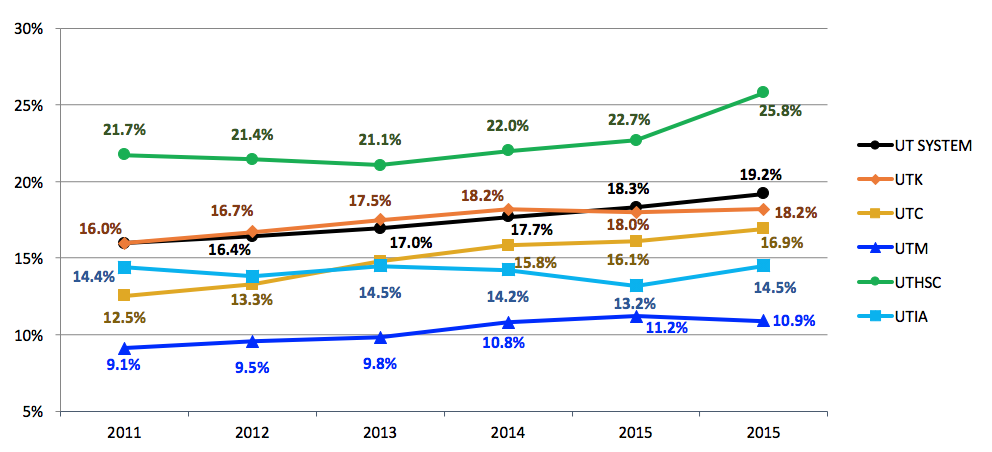
Percentage of Tenured UT Faculty that are Minorities
Faculty that are tenured or on the tenure-track are becoming more diverse. Between 2011 and 2016, the percentage of faculty who are minority increased by more than 3%.
| |
2011 |
2012 |
2013 |
2014 |
2015 |
2016 |
| UT System |
16.0% |
16.4% |
17.0% |
17.7% |
18.3% |
19.2% |
| UT Knoxville |
16.0% |
16.7% |
17.5% |
18.2% |
18.0% |
18.2% |
| UT Chattanooga |
12.5% |
13.3% |
14.8% |
15.8% |
16.1% |
16.9% |
| UT Martin |
9.1% |
9.5% |
9.8% |
10.8% |
11.2% |
10.9% |
| UT Health Science Center |
21.7% |
21.4% |
21.1% |
22.0% |
22.7% |
25.8% |
| UT Institute of Agriculture |
14.4% |
13.8% |
14.5% |
14.2% |
13.2% |
14.5% |
| Definition |
Data Source |
| Percent of faculty who are tenured or on the tenure track, as of Nov. 1. Minority faculty includes African American, Hispanic, Native American Indian, Asian, and multiracial. Data prior to 2009 not comparable, due to changes in federal reporting requirements. |
IRIS Human Resource Business Warehouse Report |
Back to top »
Goal 1. Enhancing Educational Excellence
Faculty
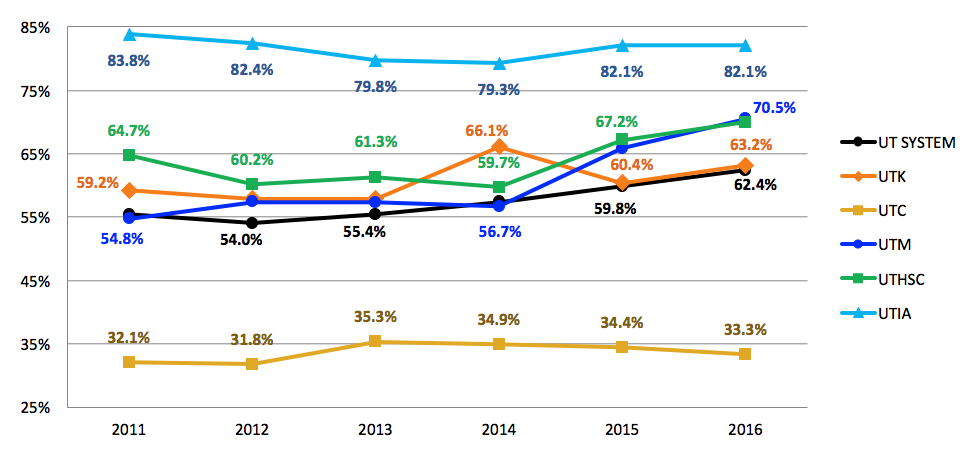
Percentage of Non-Tenure-Track UT Faculty that are Full-Time
Systemwide, the percentage of non-tenure track faculty that are full-time increased by 7% between 2011 and 2016.
| |
2011 |
2012 |
2013 |
2014 |
2015 |
2016 |
| UT System |
55.4% |
54.0% |
55.4% |
57.4% |
59.8% |
62.4% |
| UT Knoxville |
59.2% |
57.9% |
57.9% |
66.1% |
60.4% |
63.2% |
| UT Chattanooga |
32.1% |
31.8% |
35.3% |
34.9% |
34.4% |
33.3% |
| UT Martin |
54.8% |
57.4% |
57.3% |
56.7% |
65.8% |
70.5% |
| UT Health Science Center |
64.7% |
60.2% |
61.3% |
59.7% |
67.2% |
70.0% |
| UT Institute of Agriculture |
83.8% |
82.4% |
79.8% |
79.3% |
82.1% |
82.1% |
| Definition |
Data Source |
| Percentage of paid non-tenure track faculty as of Nov. 1 who are employed full-time. |
IRIS Human Resource Business Warehouse Report |
Back to top »