Goal 2: Expanding Research Capacities
Develop support systems for System research efforts that solve critical problems and issues, expand economic development and enhance the quality of life in Tennessee, the nation and the world.
Evaluation Criteria
Initiatives
- Design and implement a strategic business plan for expanding research to harness the power of the UT System’s substantial research enterprise and increase its visibility and impact.
- Promote the application and commercialization of research and development to improve the economy and develop and expand business and industry in the state.
- Define standards, measure progress and communicate research outcomes and impacts in the economy.
Goal 2. Expanding Research Capabilities
Research Activity
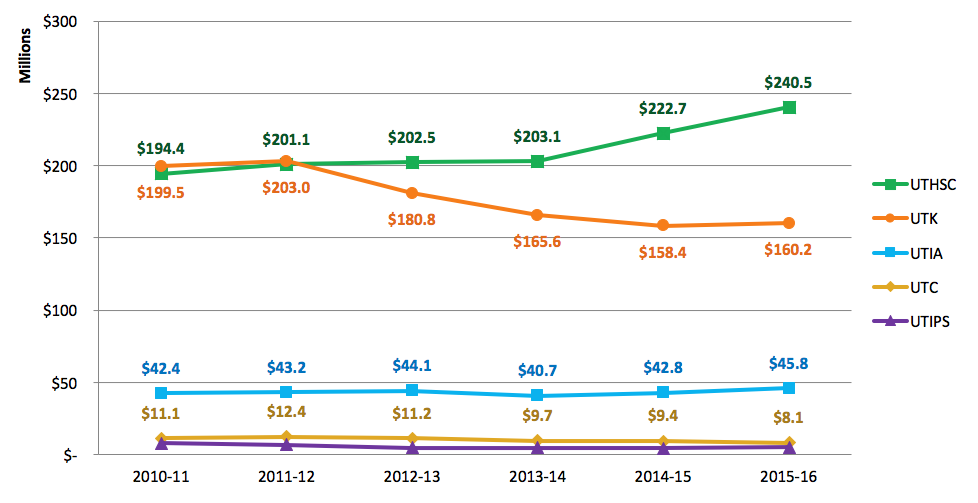
UT Research and Sponsored Program Expenditures ($M)
Systemwide, research expenditures increased about 5% over last year, with a sharp increase at UTHSC. Over the past six years, research expenditures have increased slightly, by about 1%.
| |
2010-11 |
2011-12 |
2012-13 |
2013-14 |
2014-15 |
2015-16 |
| UT Knoxville |
$199.5 M |
$203.0 M |
$180.8 M |
$165.6 M |
$158.4 M |
$160.2 M |
| UT Chattanooga |
$11.1 M |
$12.4 M |
$11.2 M |
$9.7 M |
$9.4 M |
$8.1 M |
| UT Martin |
$4.0 M |
$3.3 M |
$2.3 M |
$2.6 M |
$2.6 M |
$3.5 M |
| UT Health Science Center |
$194.4 M |
$201.1 M |
$202.5 M |
$203.1 M |
$222.7 M |
$240.5 M |
| UT Institute of Agriculture |
$42.4 M |
$43.2 M |
$44.1 M |
$40.7 M |
$42.8 M |
$45.8 M |
| UT Institute for Public Service |
$7.9 M |
$6.7 M |
$4.8 M |
$4.7 M |
$4.5 M |
$5.1 M |
| UT System Total |
$453.6 M |
$465.0 M |
$440.3 M |
$422.1 M |
$435.5 M |
$458.3 M |
| Definition |
Data Source |
| Total research and sponsored program expenditures include contracts, grants, cooperative agreements, research appropriations (e.g., Gov. Chairs), Centers of Excellence, and indirect costs. Total includes both research and sponsored program (public service research) activities. (UTK includes Vet Med |
Controller's Office: Sponsored Projects Expenditures By Campus and Type Report |
Back to top »
Goal 2. Expanding Research Capabilities
Economic Development
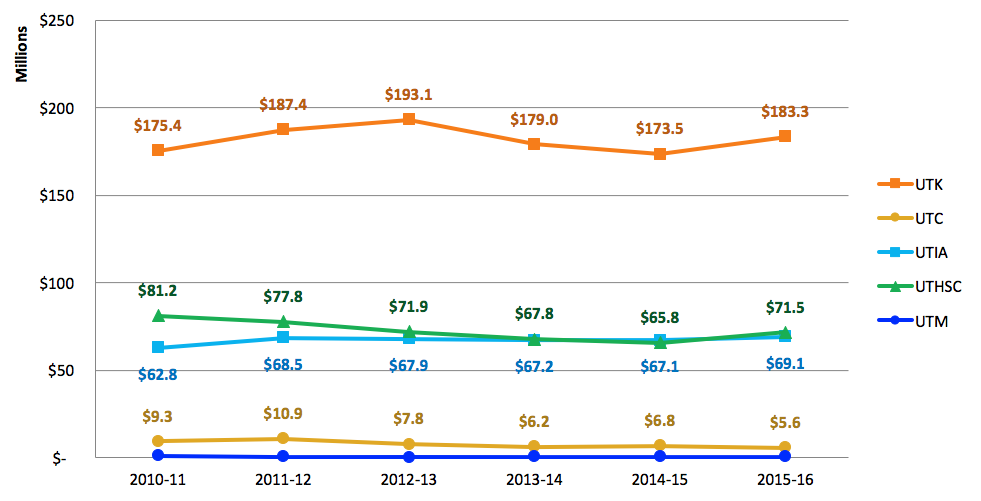
UT Total Research Expenditures ($m) (Reported to NSF)
Systemwide, research expenditures reported to National Science Foundation have increased about 2% since FY2011.
| |
2010-11 |
2011-12 |
2012-13 |
2013-14 |
2014-15 |
2015-16 |
| UT Knoxville |
$175.4 M |
$187.4 M |
$193.1 M |
$179.0 M |
$173.5 M |
$183.3 M |
| UT Chattanooga |
$9.2 M |
$10.9 M |
$7.8 M |
$6.2 M |
$6.8 M |
$5.6 M |
| UT Martin |
$1.2 M |
$0.6 M |
$0.4 M |
$0.6 M |
$0.5 M |
$0.6 M |
| UT Health Science Center |
$81.2 M |
$77.8 M |
$71.9 M |
$67.8 M |
$65.8 M |
$71.5 M |
| UT Institute of Agriculture |
$62.8 M |
$68.5 M |
$67.9 M |
$67.2 M |
$67.1 M |
$69.1 M |
| UT System Total |
$321.9 M |
$337.0 M |
$341.1 M |
$323.4 M |
$313.7 M |
$330.1 M |
| Definition |
Data Source |
| Total research and development (R&D) expenditures as reported to the National Science Foundation (NSF). These expenditures exclude public service contracts and grants, but do include indirect costs, equipment purchased from R&D accounts, clinical trials, and research training grants. |
NSF Research and Development Expenditure Report |
Back to top »
Goal 2. Expanding Research Capabilities
Research Activity
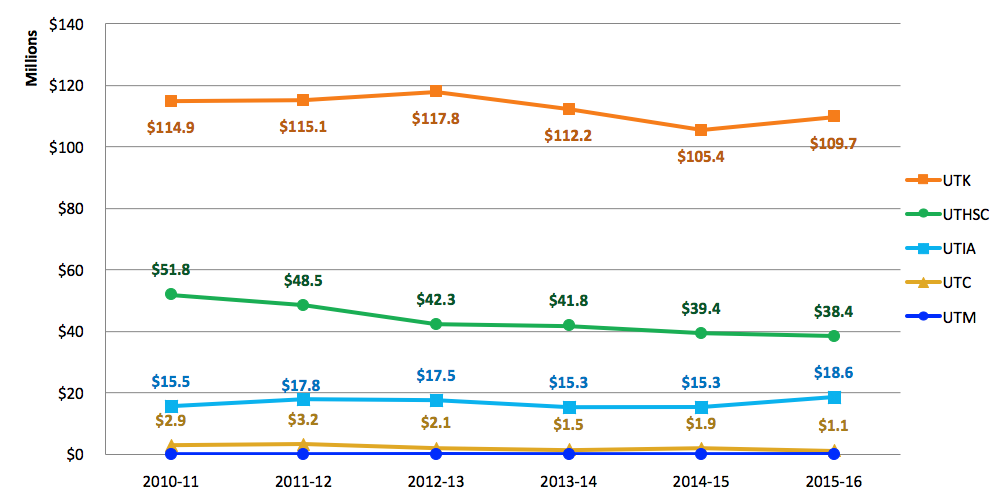
Federal Research Expenditures ($m) (Reported to NSF)
"Systemwide, federal expenditures as reported to the National Science Foundation have
declined by about 8% since 2010-11.
| |
2010-11 |
2011-12 |
2012-13 |
2013-14 |
2014-15 |
2015-16 |
| UT Knoxville |
$114.9 M |
$115.1 M |
$117.8 M |
$112.2 M |
$105.4 M |
$109.7 M |
| UT Chattanooga |
$2.9 M |
$3.2 M |
$2.1 M |
$1.5 M |
$1.9 M |
$1.1 M |
| UT Martin |
$0.0 M |
$0.1 M |
$0.0 M |
$0.0 M |
$0.0 M |
$0.1 M |
| UT Health Science Center |
$51.8 M |
$48.5 M |
$42.3 M |
$41.8 M |
$39.4 M |
$38.4 M |
| UT Institute of Agriculture |
$15.5 M |
$17.8 M |
$17.5 M |
$15.3 M |
$15.3 M |
$18.6 M |
| UT System Total |
$182.2 M |
$182.0 M |
$179.7 M |
$169.6 M |
$162.1 M |
$167.9 M |
| Definition |
Data Source |
| Total Federal research and development (R&D) expenditures as reported to the National Science Foundation (NSF). These expenditures exclude public service contracts and grants, but do include indirect costs, equipment purchased from R&D accounts, clinical trials, and research training grants. |
NSF Research and Development Expenditure Report |
Back to top »
Goal 2. Expanding Research Capabilities
Research Activity
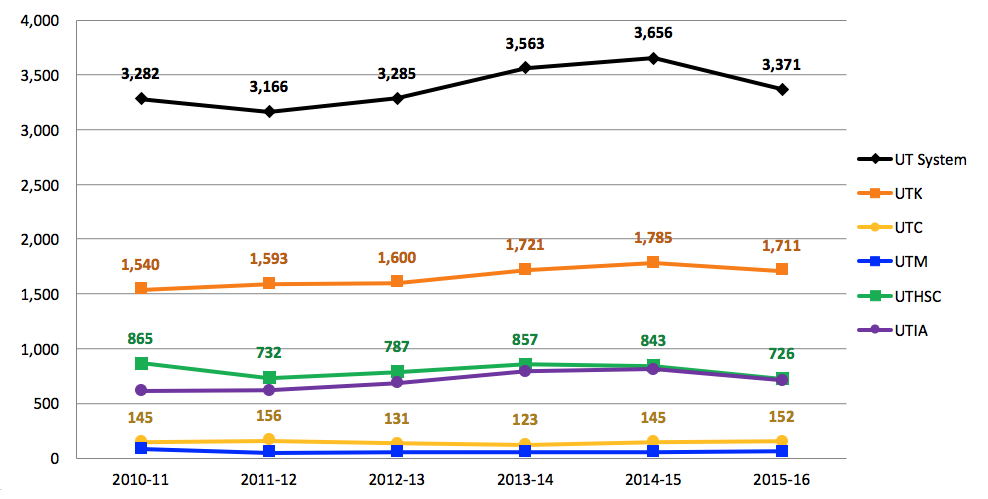
Number of UT Research Proposals
Systemwide, the number of research proposals has increased about 3% since FY2011.
| |
2010-11 |
2011-12 |
2012-13 |
2013-14 |
2014-15 |
2015-16 |
| UT Knoxville |
1,540 |
1,593 |
1,600 |
1,721 |
1,785 |
1,711 |
| UT Chattanooga |
145 |
156 |
131 |
123 |
145 |
152 |
| UT Martin |
83 |
49 |
51 |
52 |
50 |
60 |
| UT Health Science Center |
865 |
732 |
787 |
857 |
843 |
726 |
| UT Institute of Agriculture |
616 |
618 |
688 |
791 |
813 |
707 |
| UT Institute for Public Service |
33 |
20 |
27 |
17 |
20 |
15 |
| UT System Total |
3,282 |
3,166 |
3,285 |
3,563 |
3,656 |
3,371 |
| Definition |
Data Source |
| Total number of proposals submitted to or tracked by the campus Office of Research or Sponsored Programs in given academic/fiscal year. UTK includes Vet Med. |
UT Campus Office of Research or Sponsored Programs |
Back to top »
Goal 2. Expanding Research Capabilities
Research Activity
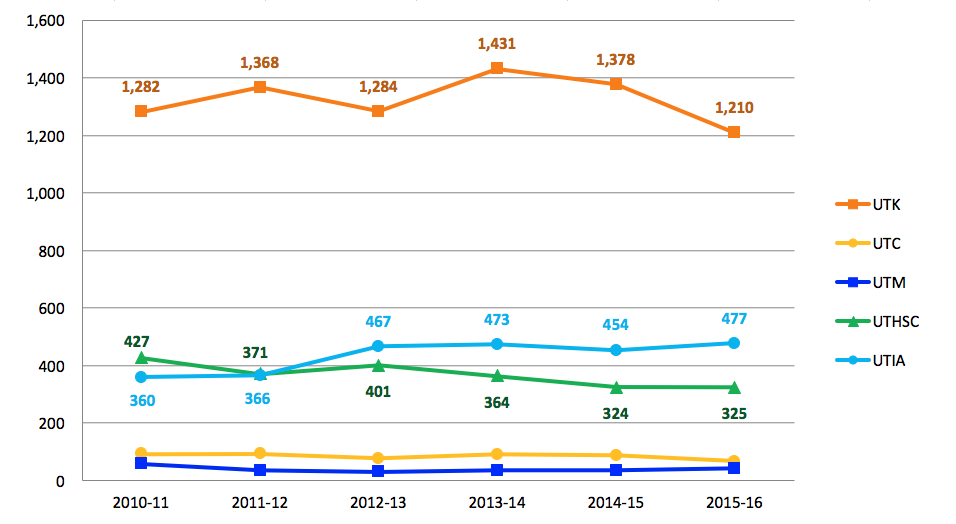
Number of Research Awards
The number of research awards has fluctuated at each institution since 2010-11. Overall, the number of awards has decreased by about 5%.
| |
2010-11 |
2011-12 |
2012-13 |
2013-14 |
2014-15 |
2015-16 |
| UT Knoxville |
1,282 |
1,368 |
1,284 |
1,431 |
1,378 |
1,210 |
| UT Chattanooga |
93 |
94 |
78 |
91 |
89 |
68 |
| UT Martin |
58 |
35 |
31 |
36 |
37 |
43 |
| UT Health Science Center |
427 |
371 |
401 |
364 |
324 |
325 |
| UT Institute of Agriculture |
360 |
366 |
467 |
473 |
454 |
477 |
| UT Institute for Public Service |
20 |
21 |
13 |
12 |
7 |
13 |
| UT System Total |
2,212 |
2,225 |
2,247 |
2,359 |
2,239 |
2,108 |
| Definition |
Data Source |
| Total number of research and/or sponsored programs proposals that were funded or awarded in a given academic/fiscal year. UTK includes Vet Med. |
UT Campus Office of Research or Sponsored Programs |
Back to top »
Goal 2. Expanding Research Capabilities
Research Activity
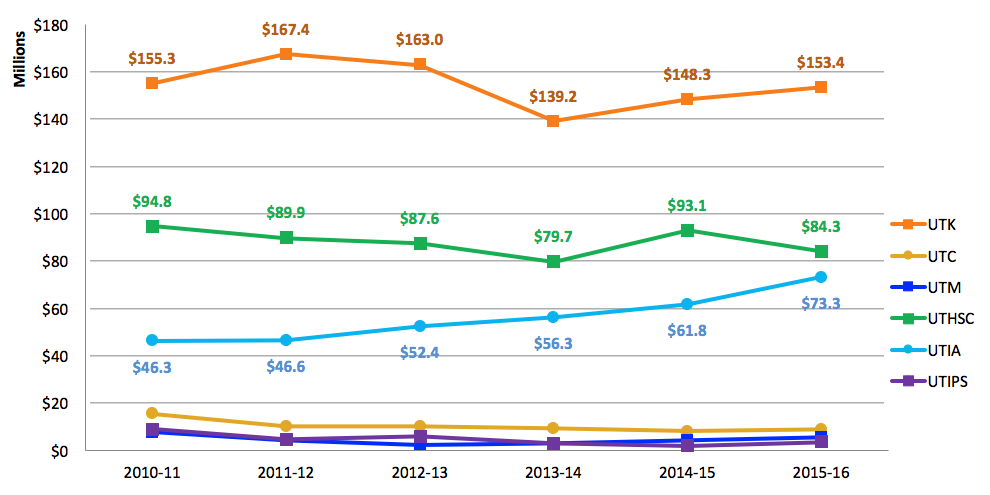
UT Research Award Dollars ($m)
Systemwide research award dollars have remained stable, with sustained increases at UTIA and decreases at UTC.
| |
2010-11 |
2011-12 |
2012-13 |
2013-14 |
2014-15 |
2015-16 |
| UT Knoxville |
$155.3 M |
$167.4 M |
$163.0 M |
$139.2 M |
$148.3 M |
$153.4 M |
| UT Chattanooga |
$15.5 M |
$10.2 M |
$10.2 M |
$9.3 M |
$8.1 M |
$8.8 M |
| UT Martin |
$7.7 M |
$4.1 M |
$2.4 M |
$3.0 M |
$4.1 M |
$5.6 M |
| UT Health Science Center |
$94.8 M |
$89.9 M |
$87.6 M |
$79.7 M |
$93.1 M |
$84.3 M |
| UT Institute of Agriculture |
$46.3 M |
$46.6 M |
$52.4 M |
$56.3 M |
$61.8 M |
$73.3 M |
| UT Institute for Public Service |
$9.0 M |
$4.8 M |
$6.1 M |
$3.1 M |
$2.1 M |
$3.6 M |
| UT System Total |
$328.6 M |
$323.0 M |
$321.7 M |
$290.6 M |
$317.4 M |
$329.0 M |
| Definition |
Data Source |
| Total number of research and/or sponsored programs proposals that were funded or awarded in a given academic/fiscal year. UTK includes Vet Med. |
UT Campus Office of Research or Sponsored Programs |
Back to top »
Goal 2. Expanding Research Capabilities
Economic Development
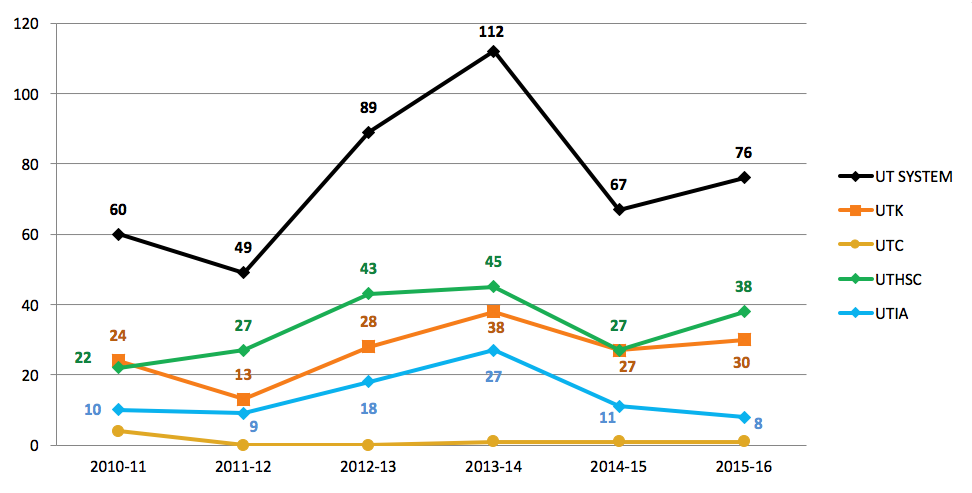
United States Patents Filed by UT
Systemwide, total number of US patents filed by UT Research Foundation has fluctuated in the past 6 years.
| |
2010-11 |
2011-12 |
2012-13 |
2013-14 |
2014-15 |
2015-16 |
| UT Knoxville |
24 |
13 |
28 |
38 |
27 |
30 |
| UT Chattanooga |
4 |
- |
- |
1 |
1 |
1 |
| UT Martin |
- |
- |
- |
1 |
1 |
- |
| UT Health Science Center |
22 |
27 |
43 |
45 |
27 |
38 |
| UT Institute of Agriculture |
9 |
18 |
27 |
11 |
8 |
| UT System Total |
60 |
49 |
89 |
112 |
67 |
76 |
| Definition |
Data Source |
| The number of new patent applications filed in the US Patent Office during the past year. It counts both provisional patent applications and utility patent applications. |
UT Research Foundation |
Back to top »
Goal 2. Expanding Research Capabilities
Economic Development
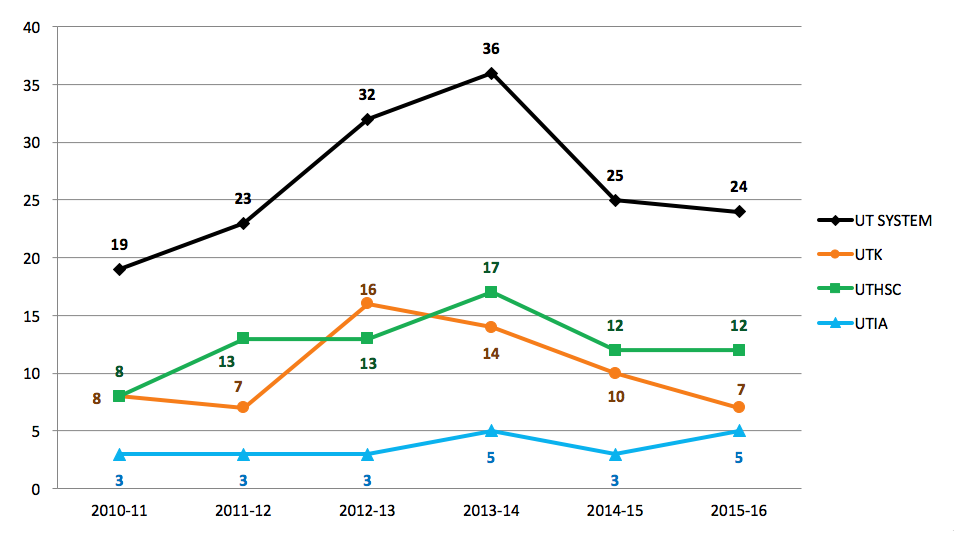
United States Patents Issued To UT
The number of US patents issued based on UT technology has fluctuated in the past 6 years.
| |
2010-11 |
2011-12 |
2012-13 |
2013-14 |
2014-15 |
2015-16 |
| UT Knoxville |
8 |
7 |
16 |
14 |
10 |
7 |
| UT Chattanooga |
- |
- |
- |
- |
- |
- |
| UT Martin |
- |
- |
- |
- |
- |
- |
| UT Health Science Center |
8 |
13 |
13 |
17 |
12 |
12 |
| UT Institute of Agriculture |
3 |
3 |
3 |
5 |
3 |
5 |
| UT System Total |
19 |
23 |
32 |
36 |
25 |
24 |
| Definition |
Data Source |
| The number of patents which successfully complete examination at the US Patent Office during the past year. An issued patent is one for which the invention described has been determined to be novel and non-obvious. An issued patent provides the inventor a 20-year period of exclusivity. |
UT Research Foundation |
Back to top »
Goal 2. Expanding Research Capabilities
Economic Development
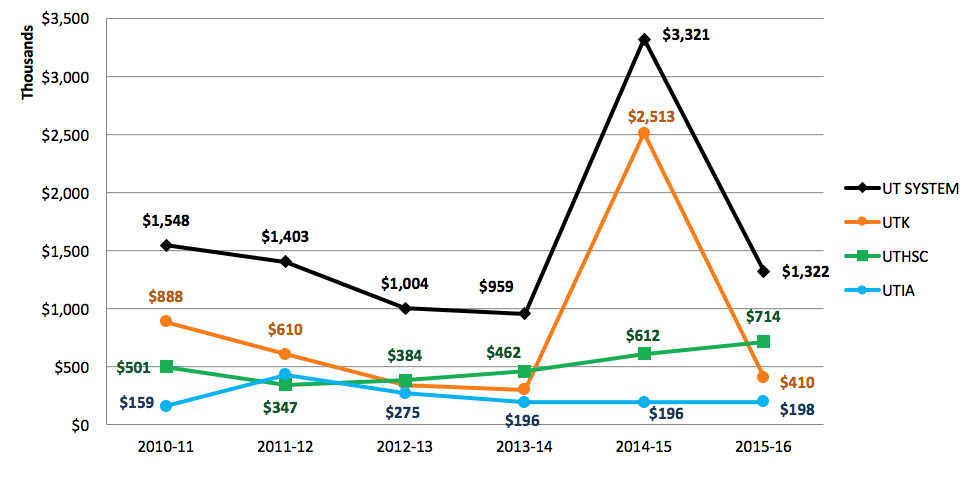
UT Royalties Revenue ($K)
Income from licenses, royalties, fees, and patent reimbursements has fluctuated at UTK, and increased at UTHSC.
| |
2010-11 |
2011-12 |
2012-13 |
2013-14 |
2014-15 |
2015-16 |
| UT Knoxville |
$887,673 |
$609,598 |
$345,931 |
$301,312 |
$2,512,600 |
$410,055 |
| UT Chattanooga |
$0 |
$15,000 |
$0 |
$0 |
$0 |
$0 |
| UT Martin |
$0 |
$0 |
$0 |
$0 |
$0 |
$0 |
| UT Health Science Center |
$500,929 |
$347,199
| $383,545
| $461,652
| $612,281
| $713,653 |
| UT Institute of Agriculture |
$159,028
| $431,604
| $274,553
| $195,557
| $196,113
| $198,137 |
| UT System Total |
$1,547,630 |
$1,403,401 |
$1,004,029 |
$958,521 |
$3,320,994 |
$1,321,845 |
| Definition |
Data Source |
| The total income received from all active licenses over the past year. Income may be in the form of fees, royalties, patent expense reimbursements, or even shares of stock that have been sold. |
UT Research Foundation |
Back to top »
Goal 2. Expanding Research Capabilities
Economic Development
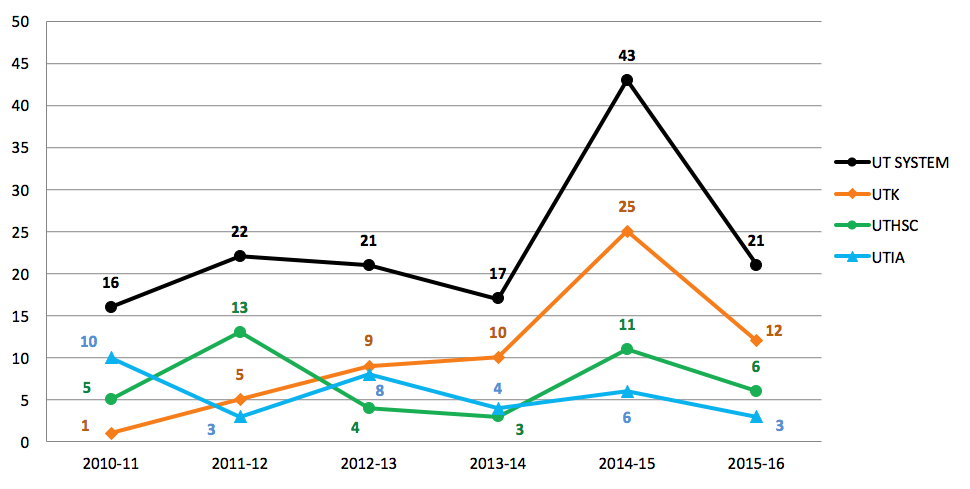
Number of Licenses Issued
The number of licenses issued to UT has flucuated at most campuses over the last 6 years.
| |
2010-11 |
2011-12 |
2012-13 |
2013-14 |
2014-15 |
2015-16 |
| UT Knoxville |
1 |
5 |
9 |
10 |
25 |
12 |
| UT Chattanooga |
- |
1 |
- |
- |
1 |
- |
| UT Martin |
- |
- |
- |
- |
- |
- |
| UT Health Science Center |
5 |
13 |
4 |
3 |
11 |
6 |
| UT Institute of Agriculture |
10 |
3 |
8 |
4 |
6 |
3 |
| UT System Total |
16 |
22 |
21 |
17 |
43 |
21 |
| Definition |
Data Source |
| The total number of new commercial agreements signed in the past year granting companies the right to access UT intellectual property. Licenses most often grant rights to use, make, or sell patented inventions, but may also involve copyrighted software or tangible materials. Industry-sponsored research agreements are not considered licenses. |
UT Research Foundation |
Back to top »
Goal 2. Expanding Research Capabilities
Economic Development
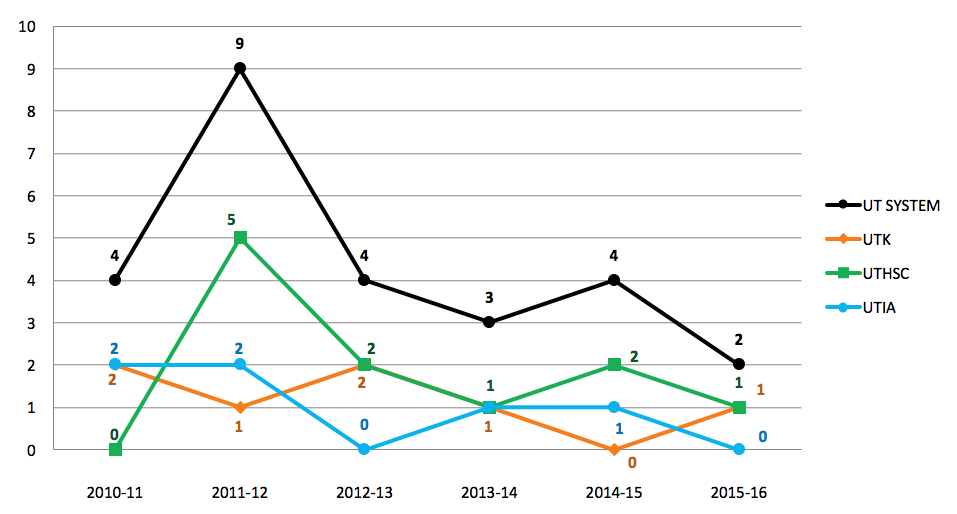
Number of Startups at UT
Systemwide, the number of new companies founded based on UT intellectual property has declined in the last 6 years.
| |
2010-11 |
2011-12 |
2012-13 |
2013-14 |
2014-15 |
2015-16 |
| UT Knoxville |
2 |
1 |
2 |
1 |
0 |
1 |
| UT Chattanooga |
0 |
1 |
0 |
0 |
0 |
0 |
| UT Martin |
0 |
0 |
0 |
0 |
1 |
0 |
| UT Health Science Center |
0 |
5 |
2 |
1 |
2 |
1 |
| UT Institute of Agriculture |
2 |
2 |
0 |
1 |
1 |
0 |
| UT System Total |
4 |
9 |
4 |
3 |
4 |
2 |
| Definition |
Data Source |
| The number of new companies that were founded around UT intellectual property over the past year. A company is only counted as a UT startup if the UT invention represents its initial intended product. Many small companies license UT intellectual property for their second or third products, these are not considered UT startups. |
UT Research Foundation |
Back to top »
Goal 2. Expanding Research Capabilities
Economic Development
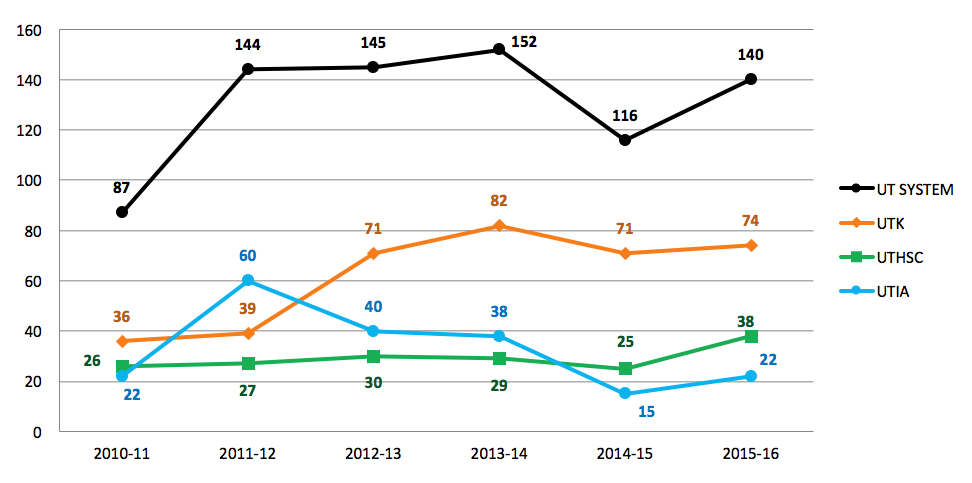
Number of UT Inventions (Disclosures)
The number of UT inventions and discoveries has increased by about 61% between FY2011 and FY2016 for the System with a noticable increase at UT Knoxville.
| |
2010-11 |
2011-12 |
2012-13 |
2013-14 |
2014-15 |
2015-16 |
| UT Knoxville |
36 |
39 |
71 |
82 |
71 |
74 |
| UT Chattanooga |
0 |
8 |
2 |
1 |
3 |
5 |
| UT Martin |
0 |
1 |
2 |
2 |
0 |
1 |
| UT Health Science Center |
26 |
27 |
30 |
29 |
25 |
38 |
| UT Institute of Agriculture |
22 |
60 |
40 |
38 |
15 |
22 |
| UT System Total |
87 |
144 |
145 |
152 |
116 |
140 |
| Definition |
Data Source |
| The number of new inventions and discoveries that were reported to UT over the past year. An invention disclosure is a form that is used to officially document the date of a new invention or discovery, describe who was involved, and provide an initial description of the new invention or discovery. Invention disclosures are usually the initial trigger for UTRF to contact an inventor and begin the evaluation and commercialization process. |
UT Research Foundation |
Back to top »