Goal 3: Fostering Outreach and Engagement
Engage members of the UT System community in outreach, engagement and service to improve communities and the quality of life of residents in Tennessee, with emphasis on economic development.
Evaluation Criteria
Initiatives
- Articulate clearly the role of the UT System in community outreach and engagement and engage all campuses/institutes in this mission.
- Promote and measure alumni and student engagement and outreach that benefit the people and communities of Tennessee.
- Track, measure and communicate the outcomes for economic development and improved quality of life for Tennesseans through a Strategic Plan dashboard.
Goal 3. Fostering Outreach and Engagement
Projects & Activities
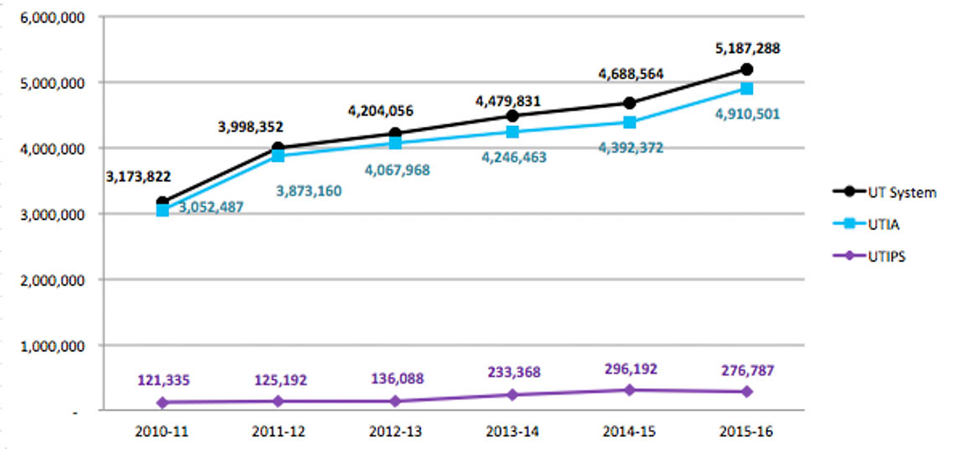
Number of Participants in Outreach and Engagement Activities
From FY2011 to FY2016, the number of participants in outreach and engagement through UT's Institutes of Public Service and Agriculture increased by 63%
| |
2010-11 |
2011-12 |
2012-13 |
2013-14 |
2014-15 |
2015-16 |
| UT Institute of Agriculture |
3,052,487 |
3,873,160 |
4,067,968 |
4,246,463 |
4,392,372 |
4,910,501 |
| UT Institute for Public Service |
121,335 |
125,192 |
136,088 |
233,368 |
296,192 |
276,787 |
| UT System Total |
3,173,822 |
3,998,352 |
4,204,056 |
4,479,831 |
4,688,564 |
5,187,288 |
| Definition |
Data Source |
| The number of direct contacts, requests for assistance, visits to the office, or on-site visits with clients or customers. |
Institute for Public Service, and Institute of Agriculture (Extension, Ag Research, and Vet Med)
|
Back to top »
Goal 3. Fostering Outreach and Engagement
Projects & Activities
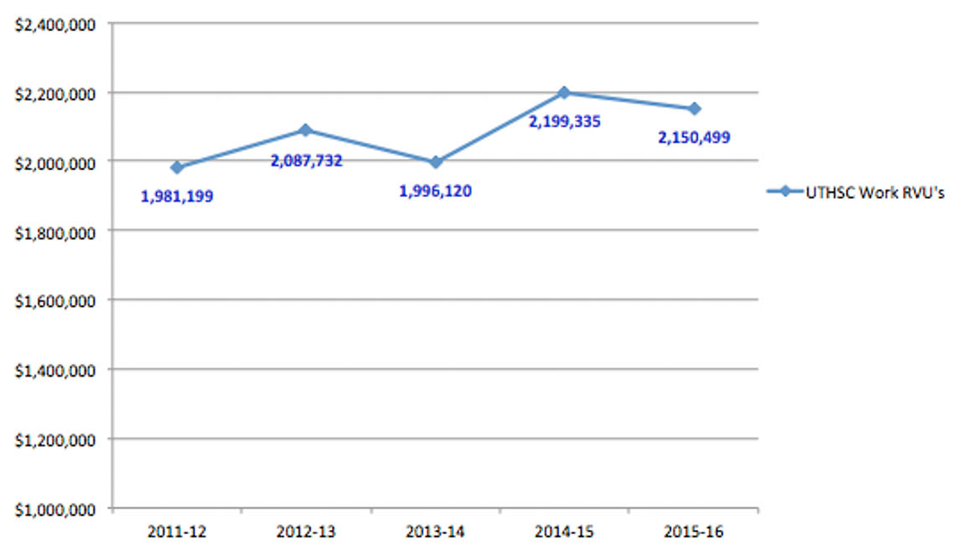
UTHSC Relative value units (RVUs) (in Millions)
The UT Health Science Center's RVUs and have increased since FY2012.
| |
2011-12 |
2012-13 |
2013-14 |
2014-15 |
2015-16 |
| UTHSC RVUs |
$3,658,608.63 |
$3,982,853.57 |
$3,733,406.58 |
$3,940,641.49 |
$3,940,641.49 |
| UTHSC Work RVUs |
$1,981,199.00 |
$2,087,732.00 |
$1,996,120.00 |
$2,199,335.00 |
$2,150,499.00 |
| Definition |
Data Source |
| The number of participants attending an outreach/ engamgment event or project for which no roster was administtered. |
Outreach and Engagment Survey (ONES) Web Survey |
Back to top »
Goal 3. Fostering Outreach and Engagement
Alumni and Volunteers
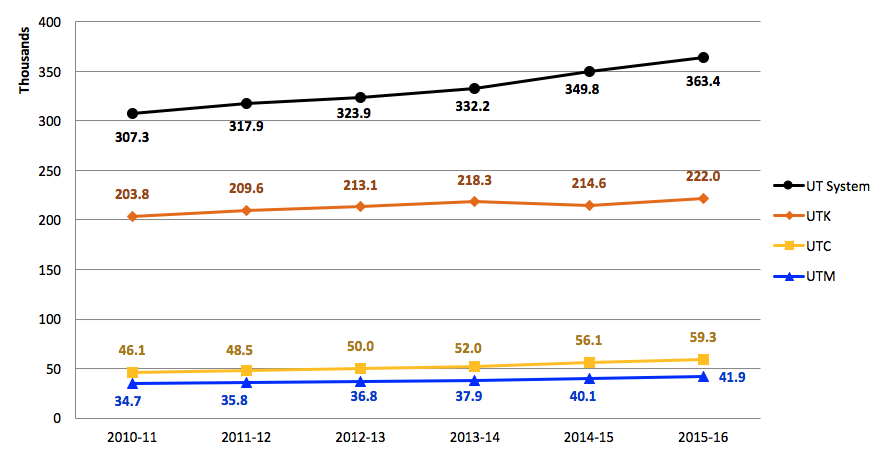
Total Alumni
The total number of UT alumni has risen by about 18% over the past 6 years.
| |
2010-11 |
2011-12 |
2012-13 |
2013-14 |
2014-15 |
2015-16 |
| UT Knoxville |
203,770 |
209,637 |
213,146 |
218,274 |
214,642 |
221,971 |
| UT Chattanooga |
46,075 |
48,482 |
50,044 |
52,006 |
56,148 |
59,300 |
| UT Martin |
34,722 |
35,839 |
36,758 |
37,930 |
40,122 |
41,907 |
| UT Health Science Center |
29,371 |
31,005 |
31,241 |
31,451 |
32,631 |
33,663 |
| UT Institute of Agriculture |
12,600 |
13,000 |
13,153 |
13,526 |
14,123 |
14,652 |
| UT System Total |
307,323 |
317,901 |
323,893 |
332,199 |
349,792 |
363,371 |
| Definition |
Data Source |
| The total number of undergraduate and graduate alumni as of June 30 of each year. Fellows, interns, licensees, and residents are not counted as alumni. Only current living alumni with an active mailing address are counted. UTK includes alumni from the Institute of Agriculture (Vet Med and CASNR). |
University of Tennessee Foundation Alumni Database |
Back to top »
Goal 3. Fostering Outreach and Engagement
Alumni and Volunteers
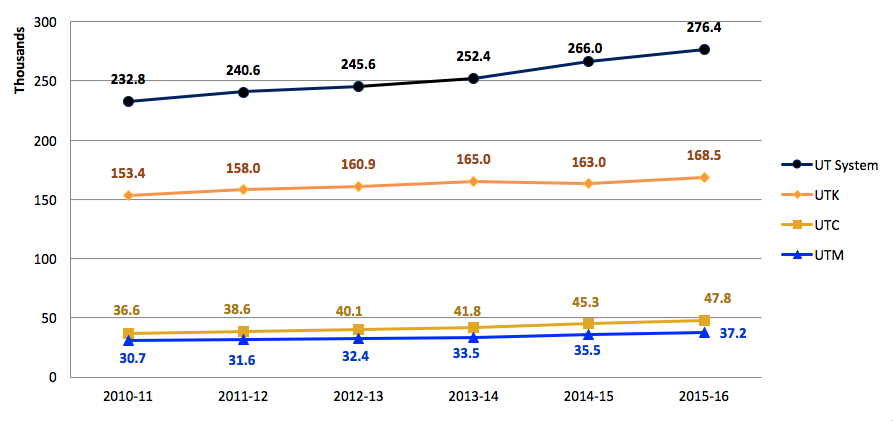
Undergraduate Alumni
Undergraduate alumni have increased steadily, by more than 43,000 over the past six years system-wide.
| |
2010-11 |
2011-12 |
2012-13 |
2013-14 |
2014-15 |
2015-16 |
| UT Knoxville |
153,350 |
157,966 |
160,944 |
164,990 |
163,037 |
168,484 |
| UT Chattanooga |
36,606 |
38,605 |
40,066 |
41,829 |
45,271 |
47,808 |
| UT Martin |
30,666 |
31,637 |
32,364 |
33,513 |
35,546 |
37,212 |
| UT Health Science Center |
10,122 |
10,399 |
10,277 |
10,105 |
10,418 |
10,715 |
| UT Institute of Agriculture |
8,714 |
8,969 |
9,089 |
9,353 |
9,745 |
10,122 |
| UT System Total |
232,770 |
240,633 |
245,629 |
252,421 |
266,040 |
276,438 |
| Definition |
Data Source |
| The number of undergraduate alumni (baccalaureate degree recipients) as of June 30 of each year. Fellows, interns, licensees, and residents are not counted as alumni. Only current living alumni with an active mailing address are counted. UTK includes alumni from the Institute of Agriculture (Vet Med and CASNR). |
University of Tennessee Foundation Alumni Database |
Back to top »
Goal 3. Fostering Outreach and Engagement
Alumni and Volunteers
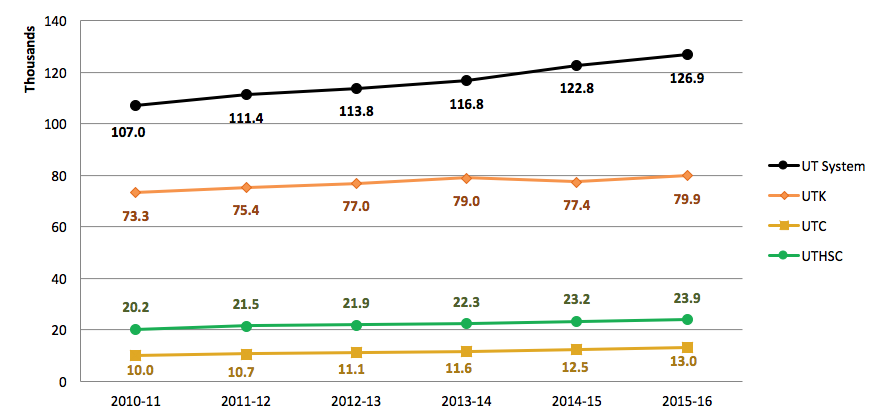
Graduate Alumni
The number of alumni from graduate level programs across the UT System has continued to rise.
| |
2010-11 |
2011-12 |
2012-13 |
2013-14 |
2014-15 |
2015-16 |
| UT Knoxville |
73,284 |
75,438 |
76,975 |
78,954 |
77,383 |
79,858 |
| UT Chattanooga |
9,986 |
10,651 |
11,117 |
11,610 |
12,475 |
13,019 |
| UT Martin |
3,365 |
3,481 |
3,559 |
3,646 |
3,789 |
3,921 |
| UT Health Science Center |
20,152 |
21,543 |
21,916 |
22,330 |
23,196 |
23,940 |
| UT Institute of Agriculture |
4,950 |
5,145 |
5,241 |
5,391 |
5,658 |
5,865 |
| UT System Total |
107,039 |
111,365 |
113,814 |
116,789 |
122,752 |
126,859 |
| Definition |
Data Source |
| The number of graduate alumni (masters, doctoral, professional degree recipients) as of June 30 of each year. Fellows, interns, licensees, and residents are not counted as alumni. Only current living alumni with an active mailing address are counted. UTK includes alumni from the Institute of Agriculture (Vet Med and CASNR). |
University of Tennessee Foundation Alumni Database |
Back to top »
Goal 3. Fostering Outreach and Engagement
Alumni and Volunteers
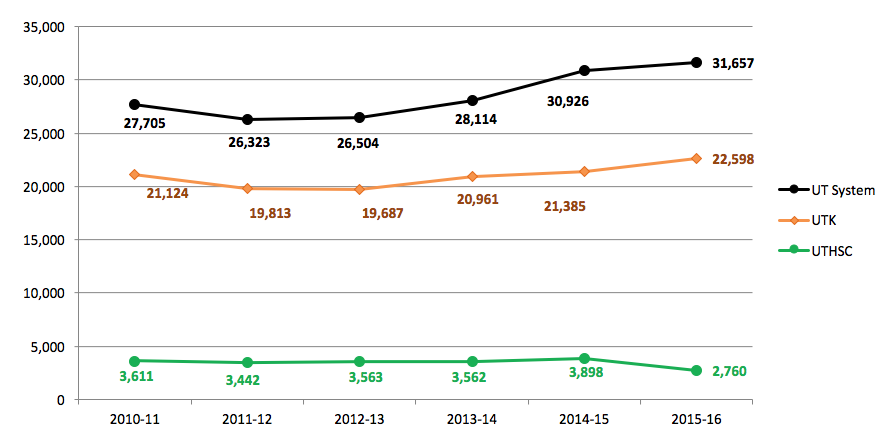
Number of Alumni who Donate Each Year
Systemwide, the overall number of alumni who donate has increased more than 11% over the past five years.
| |
2010-11 |
2011-12 |
2012-13 |
2013-14 |
2014-15 |
2015-16 |
| UT Knoxville |
21,124 |
19,813 |
19,687 |
20,961 |
21,385 |
22,598 |
| UT Chattanooga |
2,487 |
2,541 |
2,601 |
2,746 |
2,629 |
2,760 |
| UT Martin |
1,868 |
1,866 |
2,040 |
2,248 |
2,546 |
2,577 |
| UT Health Science Center |
3,611 |
3,442 |
3,563 |
3,562 |
3,898 |
2,760 |
| UT Institute of Agriculture |
1,392 |
1,349 |
1,302 |
1,415 |
1,423 |
1,563 |
| UT System Total |
27,705 |
26,323 |
26,504 |
28,114 |
30,926 |
31,657 |
| Definition |
Data Source |
| Number of alumni from the campus/institute who made at least one gift to any program/unit within the UT System; alumni with degrees from multiple campuses are counted in both campuses. UTK includes alumni from the Institute of Agriculture (Vet Med and CASNR). |
University of Tennessee Foundation |
Back to top »
Goal 3. Fostering Outreach and Engagement
Alumni and Volunteers
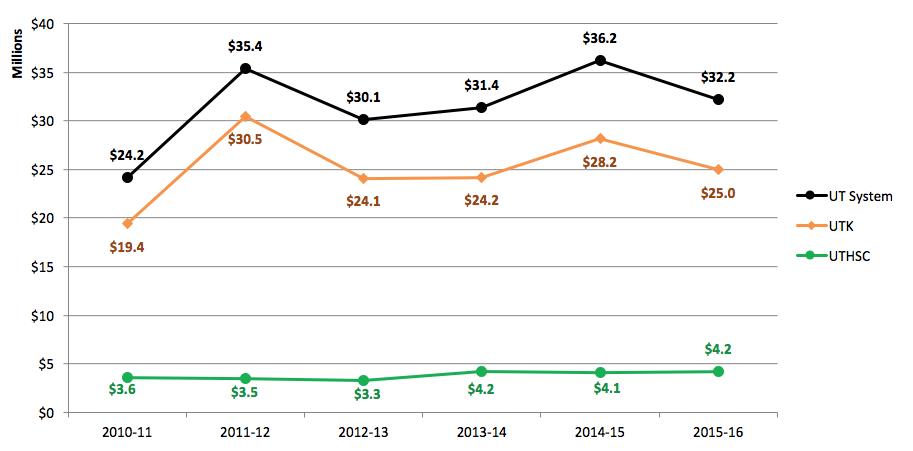
Alumni Contributions ($m)
There was a decline in alumni contributions at UT Knoxville over the past year.
| |
2010-11 |
2011-12 |
2012-13 |
2013-14 |
2014-15 |
2015-16 |
| UT Knoxville |
$19,424,712 |
$30,455,931 |
$24,088,950 |
$24,185,470 |
$28,157,057 |
$24,984,506 |
| UT Chattanooga |
$1,068,237 |
$1,230,378 |
$1,421,853 |
$1,758,396 |
$1,246,567 |
$1,613,674 |
| UT Martin |
$1,086,957 |
$1,079,588 |
$1,278,086 |
$1,135,312 |
$1,420,360 |
$1,599,680 |
| UT Health Science Center |
$3,570,962 |
$3,531,558 |
$3,292,091 |
$4,245,695 |
$4,081,514 |
$4,223,185 |
| UT Institute of Agriculture |
$652,428 |
$553,743 |
$732,272 |
$1,206,800 |
$1,220,894 |
$1,806,310 |
| UT System Total |
$24,170,610 |
$35,370,493 |
$30,129,015 |
$31,363,615 |
$36,179,720 |
$32,225,181 |
| Definition |
Data Source |
| The monetary value of gifts from UT alumni to the University of Tennessee. This excludes pledges. Dollar amounts include any corporate matching gifts received as a result of the gifts. UTK includes alumni from the Institute of Agriculture (Vet Med and CASNR). |
University of Tennessee Foundation |
Back to top »
Goal 3. Fostering Outreach and Engagement
Alumni and Volunteers
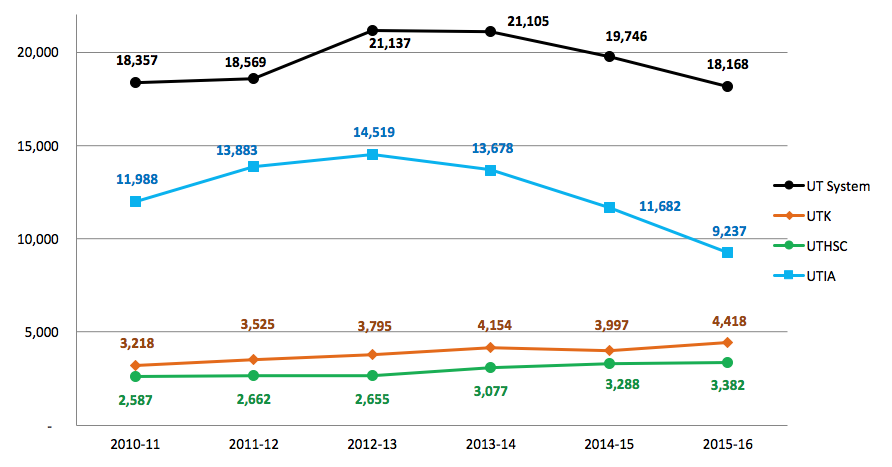
Number of Volunteers
Systemwide, the number of volunteers to the University has fluctuated over the past 6 years.
| |
2010-11 |
2011-12 |
2012-13 |
2013-14 |
2014-15 |
2015-16 |
| UT Knoxville |
3,218 |
3,525 |
3,795 |
4,154 |
3,997 |
4,418 |
| UT Chattanooga |
39 |
44 |
47 |
57 |
59 |
117 |
| UT Martin |
136 |
159 |
163 |
181 |
256 |
379 |
| UT Health Science Center |
2,587 |
2,662 |
2,655 |
3,077 |
3,288 |
3,382 |
| UT Institute of Agriculture |
11,988 |
13,883 |
14,519 |
13,678 |
11,682 |
9,237 |
| UT System Total |
18,357 |
18,569 |
21,137 |
21,105 |
19,746 |
18,168 |
| Definition |
Data Source |
| Includes Volunteers and Friends of UT in Affiliated, Clinical, Non-Clinical, and Honorary capacities. |
UT Institute of Agriculture Extension Office and UT IRIS (BW) Human Resource Data file. |
Back to top »
Goal 3. Fostering Outreach and Engagement
Economic Outcomes
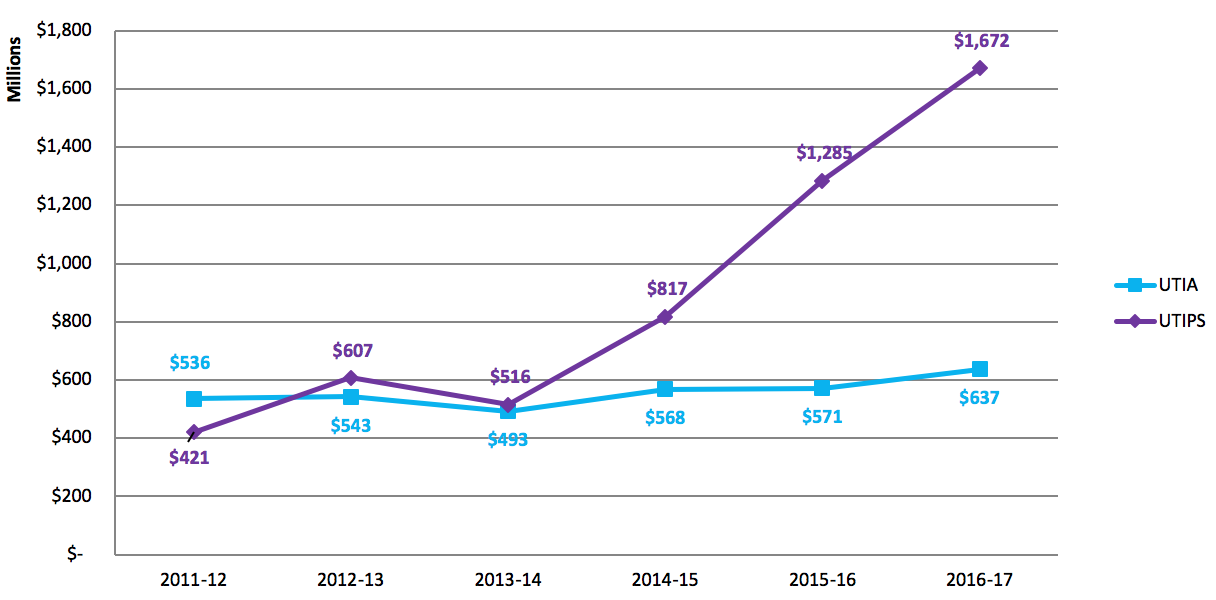
Customer-reported Economic Impact ($m)
The economic impact of the Institute for Public Service has increased to over $1.6b, and the Institute of Ag has increased to over $600m.
| |
2011-12 |
2012-13 |
2013-14 |
2014-15 |
2015-16 |
2016-17 |
| UT Institute of Agriculture |
$536,141,961 |
$542,630,690 |
$493,232,157 |
$568,321,177 |
$570,795,636 |
$637,126,034 |
| UT Institute for Public Service |
$420,849,870 |
$606,990,726 |
$515,629,544 |
$817,198,224 |
$1,285,054,698 |
$1,671,547,543 |
| Definition |
Data Source |
| Estimated economic impact of UT on the Tennessee economy. Dollars for both IPS and UTIA represent the impact clients reported to the agencies. Impact for UT-Battelle and Athletics not included. |
Customer-reported economic benefit reflec ts the value of increased sales, increased revenues, reduced costs, and capital investments by clients/customers of UT. |
Back to top »
Goal 3. Fostering Outreach and Engagement
Economic Outcomes
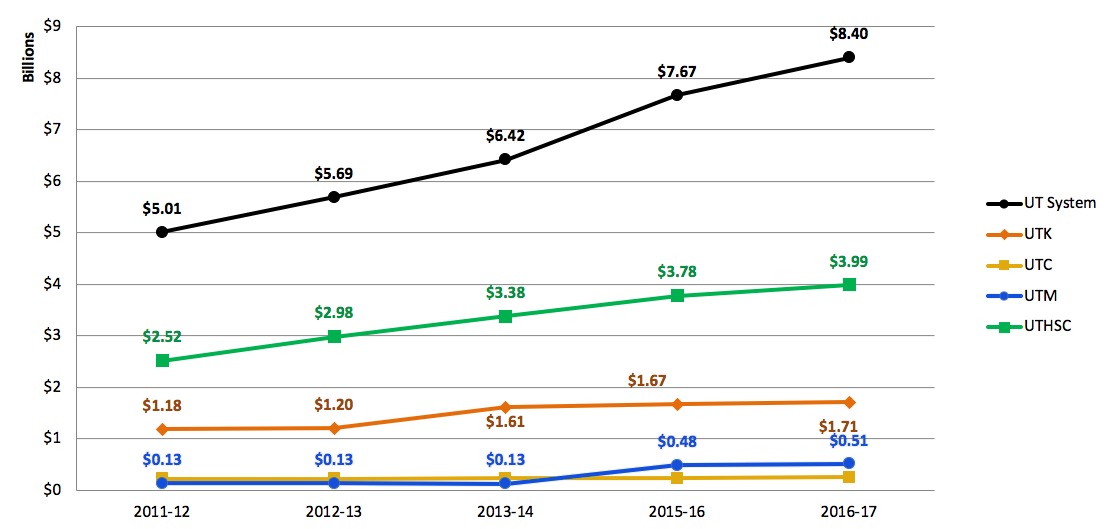
Operational Impact ($m)
In FY2017, the operational economic impact UT has had on the state of Tennessee increased to nearly $8.4 billion.
| |
2011-12 |
2012-13 |
2013-14 |
2014-15 |
2015-16 |
2016-17 |
| UT Knoxville |
$1,181,424,244 |
$1,201,155,236 |
$1,612,408,357 |
$1,611,865,093 |
$1,671,179,503 |
$1,713,467,174 |
| UT Chattanooga |
$221,207,800 |
$226,676,280 |
$231,706,042 |
$234,551,166 |
$236,846,850 |
$253,698,573 |
| UT Martin |
$132,299,725 |
$133,695,049 |
$130,586,281 |
$481,078,000 |
$482,366,825 |
$512,020,609 |
| UT Health Science Center |
$2,518,868,425 |
$2,982,274,092 |
$3,380,377,379 |
$3,478,049,886 |
$3,777,658,598 |
$3,987,008,646 |
| UT System |
$5,010,792,024 |
$5,693,422,073 |
$6,420,018,166 |
$6,837,105,562 |
$7,668,990,031 |
$8,398,138,073 |
| Definition |
Data Source |
| Estimated economic impact of UT on the Tennessee economy. Dollars for the campuses represent the income generated using traditional economic impact methodologies. Excluded from the statistics are contributions from the UT HSC clinical practice plan, UT-Battelle (Oak Ridge National Lab) and Athletics. UTIA operations included in UTK data. |
Campus data for FY08 and UTK 2014 data based on studies by Center for Business and Economic Research. Campus data for other years estimated from financial statements. |
Back to top »
Goal 3. Fostering Outreach and Engagement
Economic Outcomes
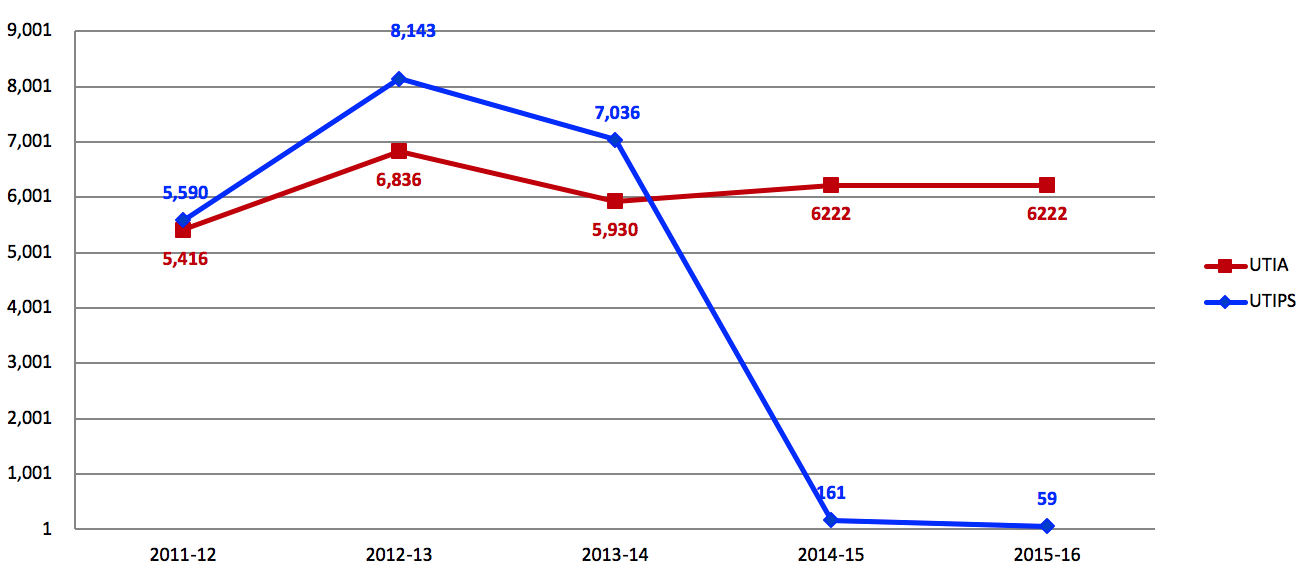
Jobs Impacted by assistance reported as client/customer-reported
The number of jobs impacted by Institute for Public Service has declined, while jobs created by UTIA slightly increased by about 22% over the last six years.
| |
2011-12 |
2012-13 |
2013-14 |
2014-15 |
2015-16 |
| UT Institute of Agriculture |
5,416 |
6,836 |
5,930 |
6,222 |
6,222 |
| UT Institute for Public Service |
5,590 |
8,143 |
7,036 |
161 |
59 |
| Definition |
Data Source |
| Estimated number of jobs created by UT. Jobs reported for both IPS and UTIA represent the impact clients report to the agencies Impact for UT-Battelle and Athletics not included. |
The number of jobs impcated by assitance reported as client/customer-reported economic benefit using a US Department of Defense, Defense Logistics Agency standard methodology. |
Back to top »
Goal 3. Fostering Outreach and Engagement
Economic Outcomes
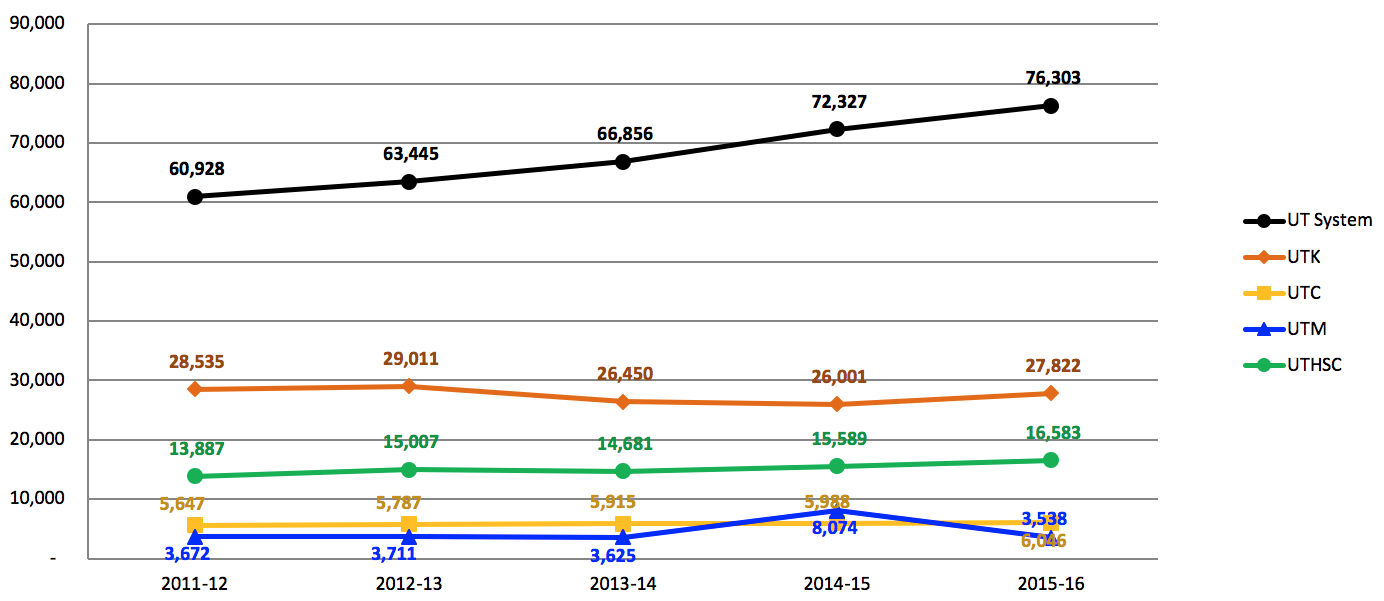
Jobs Created by the University
In FY2016, UT operations created over 75,000 jobs in the State of Tennessee.
| |
2011-12 |
2012-13 |
2013-14 |
2014-15 |
2015-16 |
| UT Knoxville |
28,535 |
29,011 |
26,450 |
26,001 |
27,822 |
| UT Chattanooga |
5,647 |
5,787 |
5,915 |
5,988 |
6,046 |
| UT Martin |
3,672 |
3,711 |
3,625 |
8,074 |
3,538 |
| UT Health Science Center |
13,887 |
15,007 |
14,681 |
15,589 |
16,583 |
| UT System |
60,928 |
63,445 |
66,856 |
72,327 |
76,303 |
| Definition |
Data Source |
| Estimated number of jobs created by UT using traditional economic impact methodologies. Excluded from the statistics are contributions from the UT HSC clinical practice plan, UT-Battelle (Oak Ridge National Lab) and Athletics. UTIA operations included in UTK data. |
Campus data for FY08 based on study by Center for Business and Economic Research. Campus data for other years estimated from financial statements. |
Back to top »