The Complete College Tennessee Act of 2010 revised law governing higher education in this state and provided a new funding formula based on outcomes. Learn more.
Evaluation Metrics
Complete College Tennessee Act
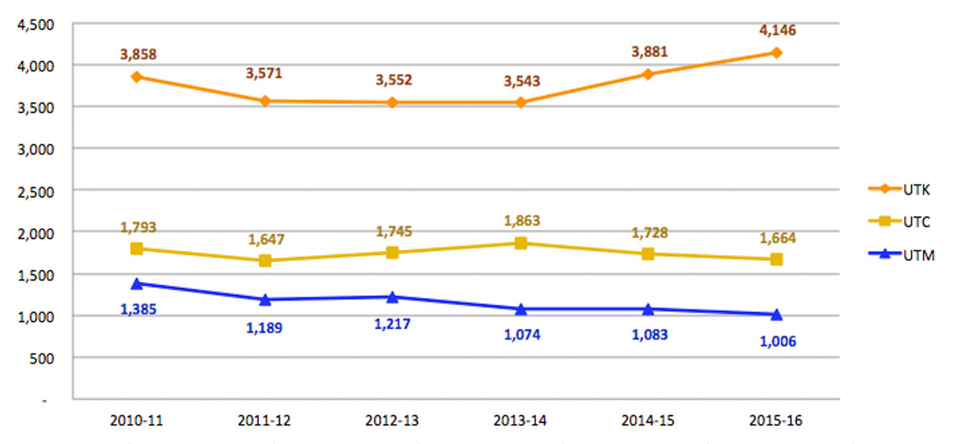
UT Students Accumulating 30 Credit Hours
The number of students accumulating 30 hours has increased at UTK but declined at UTC and UTM.
| |
2010-11 |
2011-12 |
2012-13 |
2013-14 |
2014-15 |
2015-16 |
| UT Knoxville |
3,858 |
3,571 |
3,552 |
3,543 |
3,881 |
4,146 |
| UT Chattanooga |
1,793 |
1,647 |
1,745 |
1,863 |
1,728 |
1,664 |
| UT Martin |
1,385 |
1,189 |
1,217 |
1,074 |
1,083 |
1,006 |
| UT System Total |
7,036 |
6,407 |
6,514 |
6,480 |
6,692 |
6,816 |
| Definition |
Data Source |
| Number of students who pass the 30 cumulative student credit hour benchmark during the prior academic year (summer, fall, spring semesters). Data are not comparable over time due to a change in definition combined with errors in THEC calculation program. |
THEC Student Information Systems |
Back to top »
Complete College Tennessee Act
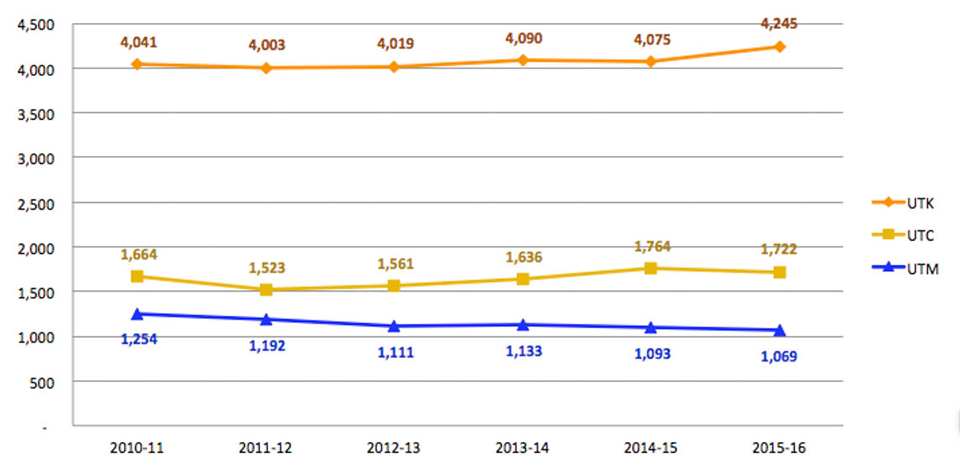
UT Students Accumulating 60 Credit Hours
The number of students accumulating 60 hours has remained relatively steady over the last 6 years with UTK showing an increase over last year.
| |
2010-11 |
2011-12 |
2012-13 |
2013-14 |
2014-15 |
2015-16 |
| UT Knoxville |
4,041 |
4,003 |
4,019 |
4,090 |
4,075 |
4,245 |
| UT Chattanooga |
1,664 |
1,523 |
1,561 |
1,636 |
1,764 |
1,722 |
| UT Martin |
1,254 |
1,192 |
1,111 |
1,133 |
1,093 |
1,069 |
| UT System Total |
6,959 |
6,718 |
6,691 |
6,859 |
6,932 |
7,036 |
| Definition |
Data Source |
| Number of students who pass the 60 cumulative student credit hour benchmark during the prior academic year (summer, fall, spring semesters). Data are not comparable over time due to a change in definition combined with errors in THEC calculation program. |
THEC Student Information Systems |
Back to top »
Complete College Tennessee Act
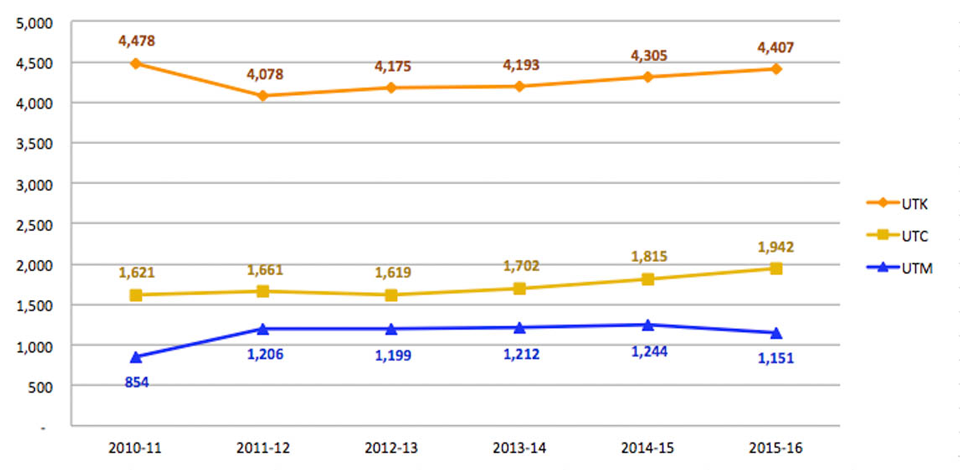
UT Students Accumulating 90 Credit Hours
Students accumulating 90 hours has beeen relatively constant over the past 6 years.
| |
2010-11 |
2011-12 |
2012-13 |
2013-14 |
2014-15 |
2015-16 |
| UT Knoxville |
4,478 |
4,078 |
4,175 |
4,193 |
4,305 |
4,407 |
| UT Chattanooga |
1,621 |
1,661 |
1,619 |
1,702 |
1,815 |
1,942 |
| UT Martin |
854 |
1,206 |
1,199 |
1,212 |
1,244 |
1,151 |
| UT System Total |
6,953 |
6,945 |
6,993 |
7,107 |
7,364 |
7,500 |
| Definition |
Data Source |
| Number of students who pass the 90 cumulative student credit hour benchmark during the prior academic year (summer, fall, spring semesters). |
THEC Student Information Systems |
Back to top »
Complete College Tennessee Act
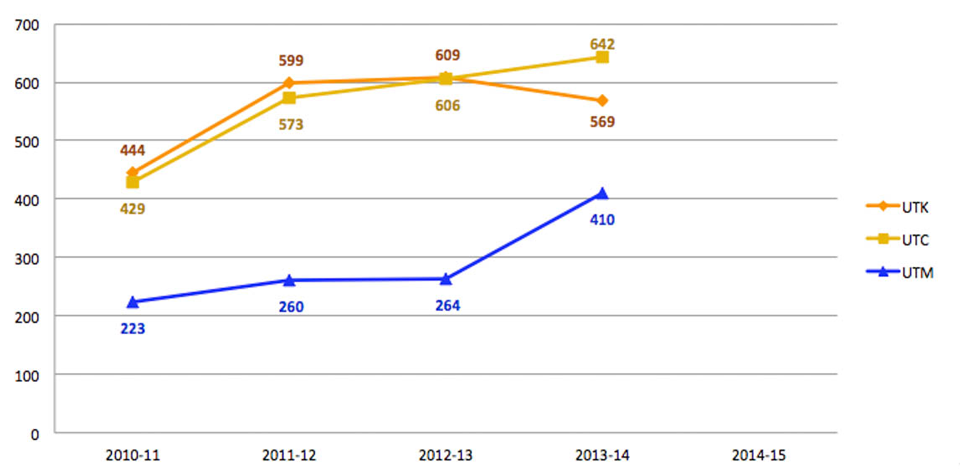
UT Undergraduates Transferring Out With 12 Hours
| |
2010-11 |
2011-12 |
2012-13 |
2013-14 |
2014-15 |
| UT Knoxville |
444 |
599 |
609 |
569 |
– |
| UT Chattanooga |
429 |
573 |
606 |
642 |
– |
| UT Martin |
223 |
260 |
264 |
410 |
– |
| UT System Total |
1,389 |
1,432 |
1,479 |
1,621 |
– |
| Definition |
Data Source |
| Number of students who transferred out to any public, private or out-of-state institution in the prior academic year who had accumulated at least 12 student credit hours at UT. |
THEC Student Information Systems |
Back to top »
Complete College Tennessee Act
Six-Year Graduation Rate for New UT Freshmen
Over the last 5 years, graduation rates for new freshmen have increased at UT Knoxville and UT Chattanooga, but have declined at UT Martin.
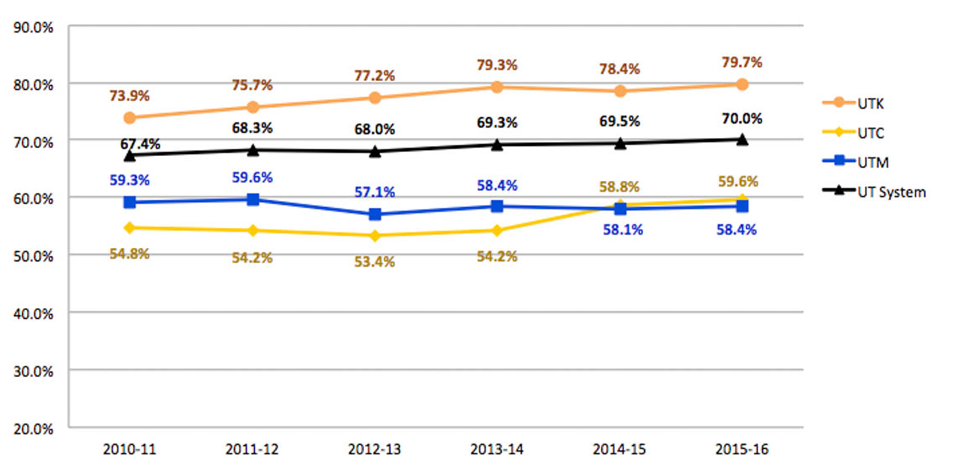
| |
2010-11 |
2011-12 |
2012-13 |
2013-14 |
2014-15 |
2015-16 |
| UT Knoxville |
73.9% |
75.7% |
77.2% |
79.3% |
78.4% |
79.7% |
| UT Chattanooga |
54.8% |
54.2% |
53.4% |
54.2% |
58.8% |
59.6% |
| UT Martin |
59.3% |
59.6% |
57.1% |
58.4% |
58.1% |
58.4% |
| UT System Average |
67.4% |
68.3% |
68.0% |
69.3% |
69.5% |
70.0% |
| Definition |
Data Source |
| Graduation rate for summer/fall first-time, full-time freshman who enrolled six years earlier (e.g., 2010-11 graduation rates represents rate for new freshmen entering in 2004. |
THEC Student Information Systems |
Back to top »
Complete College Tennessee Act
Bachelor's Degrees Awarded
Since 2010-11, the number of bachleors degrees awarded systemwide has increased by over 16%
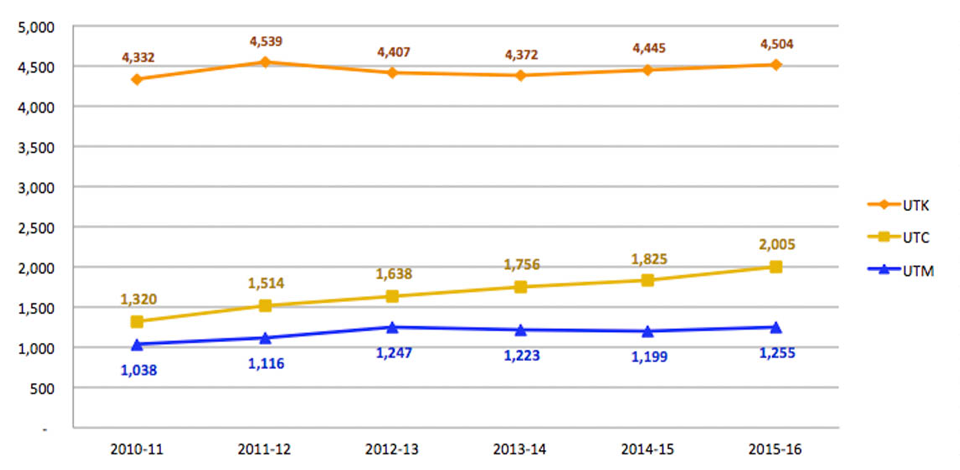
| |
2010-11 |
2011-12 |
2012-13 |
2013-14 |
2014-15 |
2015-16 |
| UT Knoxville |
4,332 |
4,539 |
4,407 |
4,372 |
4,445 |
4,504 |
| UT Chattanooga |
1,320 |
1,514 |
1,638 |
1,756 |
1,825 |
2,005 |
| UT Martin |
1,038 |
1,116 |
1,247 |
1,223 |
1,199 |
1,255 |
| UT System Total |
6,690 |
7,169 |
7,292 |
7,351 |
7,469 |
7,764 |
| Definition |
Data Source |
Number of bachelor's degrees conferred during the prior academic year (Summer, Fall, Spring).
Note: This is an unduplicated headcount and may not coincide with the Degrees Awarded graphs in Goal 1.
|
THEC Student Information Systems |
Back to top »
Complete College Tennessee Act
Master/Education Specialist Degrees Awarded
The number of masters and educational specialist degrees awarded has declined over the last 6 years.
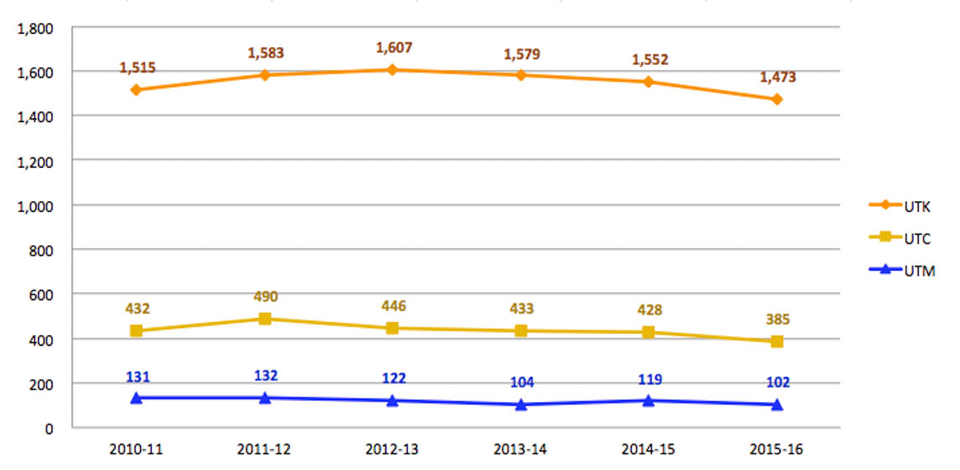
| |
2010-11 |
2011-12 |
2012-13 |
2013-14 |
2014-15 |
2015-16 |
| UT Knoxville |
1,515 |
1,583 |
1,607 |
1,579 |
1,552 |
1,473 |
| UT Chattanooga |
432 |
490 |
446 |
433 |
428 |
385 |
| UT Martin |
131 |
132 |
122 |
104 |
119 |
102 |
| UT System Total |
2,078 |
2,205 |
2,175 |
2,116 |
2,099 |
1,960 |
| Definition |
Data Source |
Number of master's and education specialist degrees conferred during the prior academic year (Summer, Fall, Spring).
Note: This is an unduplicated headcount and may not coincide with the Degrees Awarded graphs in Goal 1.
|
THEC Student Information Systems |
Back to top »
Complete College Tennessee Act
Doctoral and Professional Degrees Awarded
The number of Doctoral and professional degrees awarded has increased about 17% over the past 6 years.
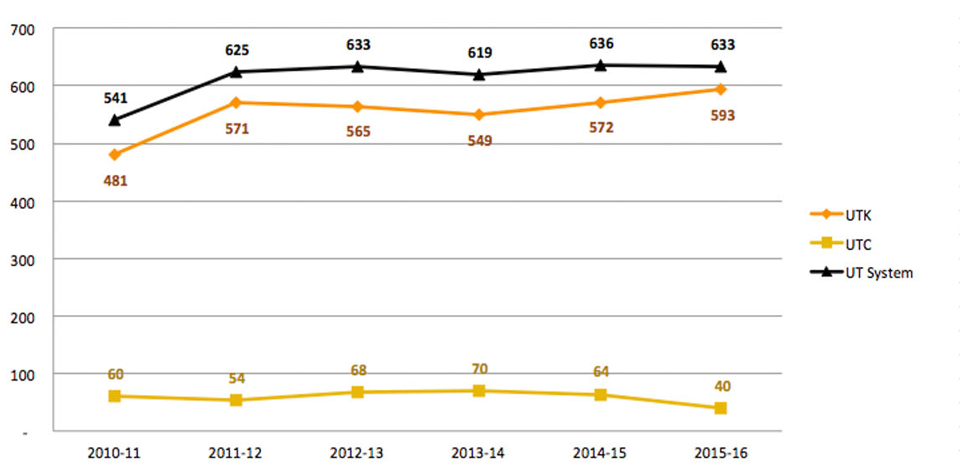
| |
2010-11 |
2011-12 |
2012-13 |
2013-14 |
2014-15 |
2015-16 |
| UT Knoxville |
481 |
571 |
565 |
549 |
572 |
593 |
| UT Chattanooga |
60 |
54 |
68 |
70 |
64 |
40 |
| UT System Total |
541 |
625 |
633 |
619 |
636 |
633 |
| Definition |
Data Source |
Number of doctoral and law degrees conferred during the prior academic year (Summer, Fall, Spring).
Note: This is an unduplicated headcount and may not coincide with the Degrees Awarded graphs in Goal 1.
|
THEC Student Information Systems |
Back to top »
Complete College Tennessee Act
UT Bachelor's Degrees per 100 Student FTE
The number of bachelors degrees per 100 student FTE has increased significantly at UT Chattanooga and UT Martin, and has remained relatively constant at UT Knoxville.
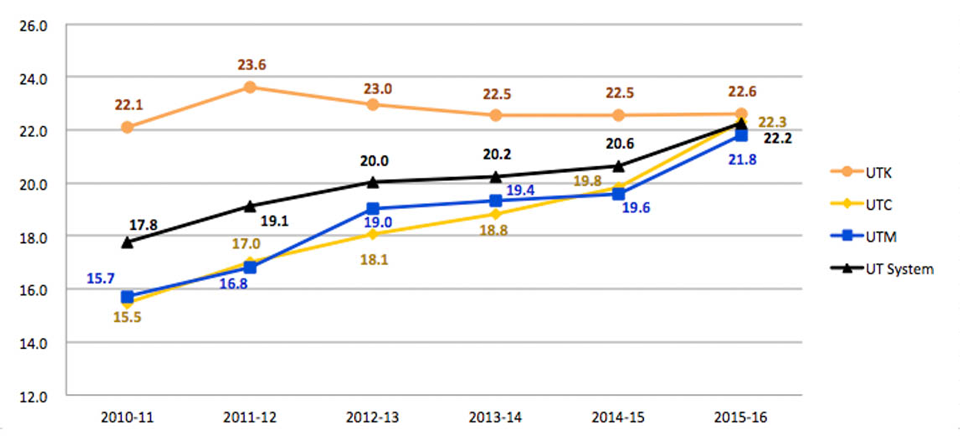
| |
2010-11 |
2011-12 |
2012-13 |
2013-14 |
2014-15 |
2015-16 |
| UT Knoxville |
21.1 |
23.6 |
23.0 |
22.5 |
22.5 |
22.6 |
| UT Chattanooga |
15.5 |
17.0 |
18.1 |
18.8 |
19.8 |
22.3 |
| UT Martin |
15.7 |
16.8 |
19.0 |
19.4 |
19.6 |
21.8 |
| UT System Average |
17.8 |
19.1 |
20.0 |
20.2 |
20.6 |
22.2 |
| Definition |
Data Source |
| Number of bachelor's degrees conferred during the prior academic year (summer, fall, spring semesters) divided by undergraduate FTE generated during the academic year. Data are not comparable over time due to a change in definition combined with errors in THEC calculation program. |
THEC Student Information Systems |
Back to top »
Complete College Tennessee Act
UT Research Expenditures
Research Expenditures have decreased at UT Knoxville and UT Chattanooga.
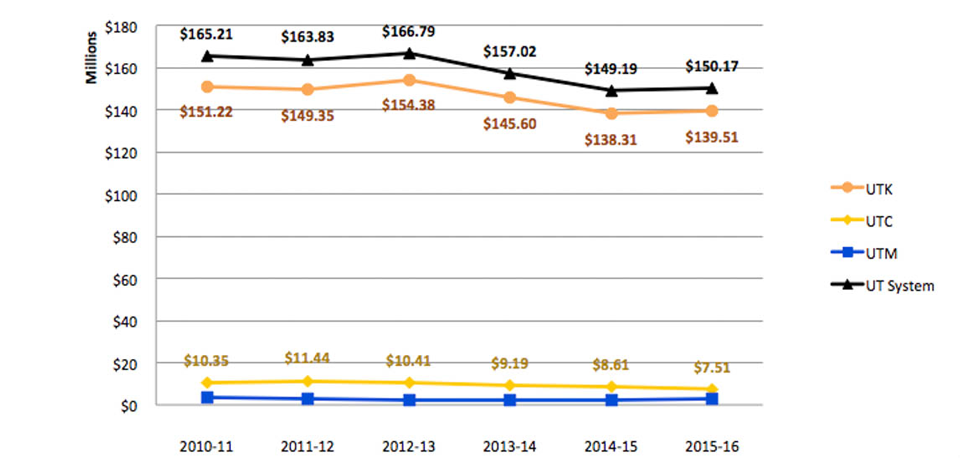
| |
2010-11 |
2011-12 |
2012-13 |
2013-14 |
2014-15 |
2015-16 |
| UT Knoxville |
$151,215,597 |
$149,350,434 |
$154,378,165 |
$145,602,228 |
$138,314,792 |
$139,510,443 |
| UT Chattanooga |
$10,350,479 |
$11,444,947 |
$10,409,340 |
$9,186,021 |
$8,607,946 |
$7,510,256 |
| UT Martin |
$3,646,780 |
$3,036,994 |
$2,001,804 |
$2,233,932 |
$2,270,725 |
$3,145,290 |
| UT System Total |
$165,212,856 |
$163,832,376 |
$166,789,309 |
$157,022,181 |
$149,193,463 |
$150,165,989 |
| Definition |
Data Source |
| Expenditures on activities eligible for indirect cost allocation, primarily but not exclusively externally generated funding for research, service or instruction. UTK excludes UTIA and Space Institute, IPS, and UT Health Science Center. |
Reported by UT Controller's Office |
Back to top »