Goal 4: Ensuring Effectiveness and Efficiency
Systematically invest in the UT System’s infrastructure and rigorously implement support mechanisms and practices that ensure the success of Strategic Plan aspirations and goals and effective and efficient delivery of services.
Evaluation Criteria
Initiatives
- Catalyze and support collaboration across the UT System and with external partners, including removing policy and procedural roadblocks, to strengthen the impact of the UT System as greater than the sum of its parts.
- Define a System Administration approach to a service culture that is modeled by the System Administration and support campus and institute strategic goals with services, information and data.
- Implement Employer of Choice standards across the UT System.
- Create a “culture of communication” throughout the UT System through an improved internal communications program—both between the System and the campuses and institutes and the campuses and institutes with each other—that regularly informs the UT community about System goals, processes and services through multiple channels.
- Collaborate with campuses and institutes to define the facilities and space necessary for an environment of excellence in research, education and outreach.
- Identify and promote compelling opportunities for continued and expanded investment in the various entities of the UT System by the federal, state, county, industry and philanthropic communities.
- Extend diversity initiatives throughout the System for faculty, staff, students and cultural/community life.
Goal 4. Ensuring Effectiveness and Efficiency
Revenues
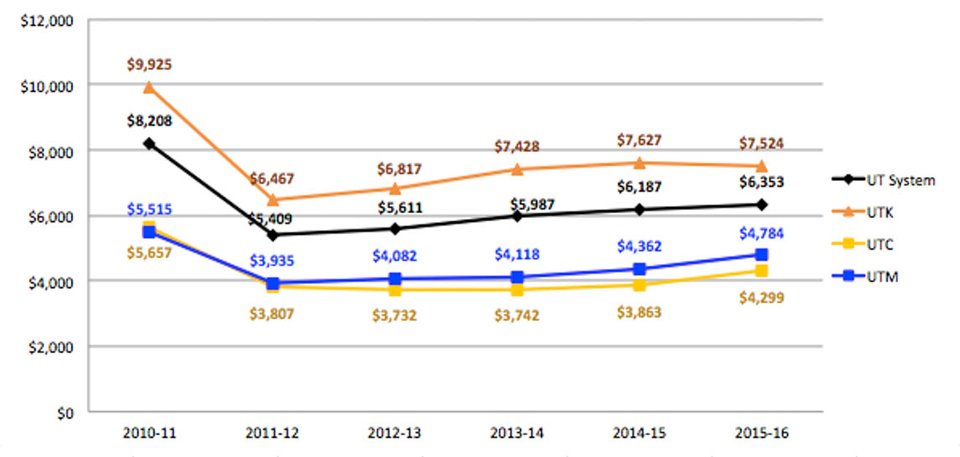
State Appropriation
per Student Full-Time Equivalent (FTE) in 2016 dollars
State Appropriations per Student FTE increased slightly since FY2012 for all campuses but still remain below FY2011 levels.
|
2010 - 11 |
2011 - 12 |
2012 - 13 |
2013 - 14 |
2014 - 15 |
2015 - 16 |
| UT Knoxville |
$9,925 |
$6,467 |
$6,817 |
$7,428 |
$7,627 |
$7,524 |
| UT Chattanooga |
$5,657 |
$3,807 |
$3,732 |
$3,742 |
$3,863 |
$4,299 |
| UT Martin |
$5,515 |
$3,935 |
$4,082 |
$4,118 |
$4,362 |
$4,784 |
| UT System |
$8,208 |
$5,409 |
$5,611 |
$5,987 |
$6,187 |
$6,353 |
| Definition |
Data Source |
Total state appropriations per fall student FTE as reported to Tennessee Higher Education Commission.
Amount per student FTE are in 2012 dollars and have been adjusted for inflation using HEPI index. Student FTE is the number of full‐time student equivalents in the fall semester. |
UT Budget Office |
Back to top »
Goal 4. Ensuring Effectiveness and Efficiency
Revenues
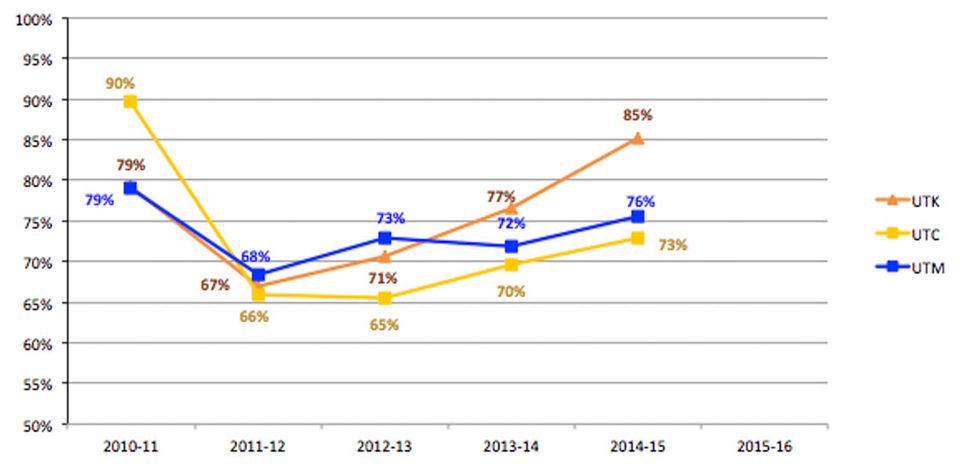
State Appropriation and Tuition/Fee Revenue per Student Full-Time Equivalent (FTE) compared to Campus Peer Group
State Appropriations and Tuition/Fee per Student FTE is 15-27% below the peer average.
|
2010 - 11 |
2011 - 12 |
2012 - 13 |
2013 - 14 |
2014 - 15 |
2015 - 16 |
| UT Knoxville |
79% |
67% |
71% |
77% |
85% |
– |
| UT Chattanooga |
90% |
66% |
65% |
70% |
73% |
– |
| UT Martin |
79% |
68% |
73% |
72% |
76% |
– |
| UT System |
83% |
67% |
70% |
73% |
78% |
– |
| Definition |
Data Source |
| This metric measures the combined state approopriation and tuition/fee revenue divided by the student FTE. Some campuses are able to charge lower tuition as their states provide higher levels of state appropriate and vice versa. 100% equals the peer average. Less than 100% is below the peer average. |
IPEDS and Campus Financial Statements |
Back to top »
Goal 4. Ensuring Effectiveness and Efficiency
Revenues
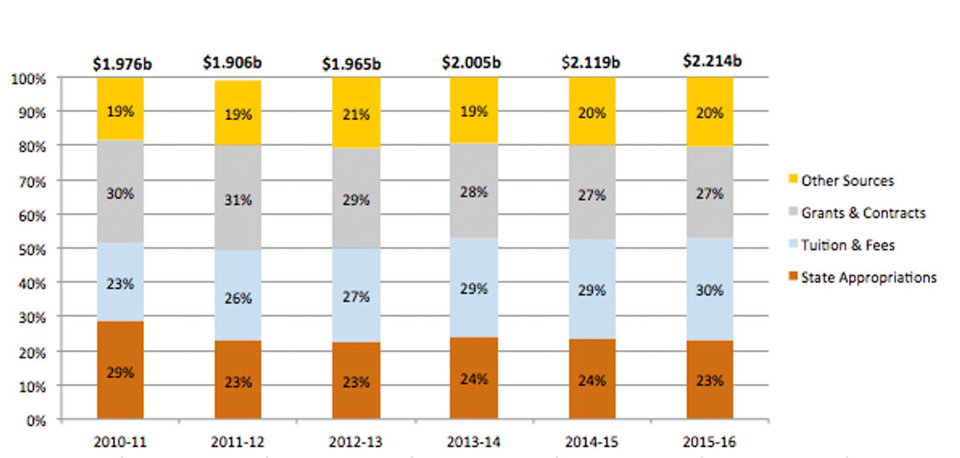
UT System: Current Revenues by Major Source
Systemwide, from FY2011 to FY2016, state appropriations as a percent of total revenues fell from 29% to 30%, while tuition and fee revenue rose from 22% to 29%.
| UT System |
2010 - 11 |
2011 - 12 |
2012 - 13 |
2013 - 14 |
2014 - 15 |
2015 - 16 |
| State Appropriations |
29% |
23% |
23% |
24% |
24% |
23% |
| Tuition & Fees |
23% |
26% |
27% |
29% |
29% |
30% |
| Grants & Contracts |
30% |
31% |
29% |
28% |
27% |
27% |
| Other Sources |
19% |
19% |
21% |
19% |
20% |
20% |
| Definition |
Data Source |
| Total current fund revenues (unrestricted and restricted) by major sources of funds. "Other Sources" includes private gifts, endowment income, sales and services of educational activities, auxiliary, and other sources. "Grants and contracts" includes federal, state, local, and private grants and contracts. | UT Budget Office |
Back to top »
Goal 4. Ensuring Effectiveness and Efficiency
Revenues
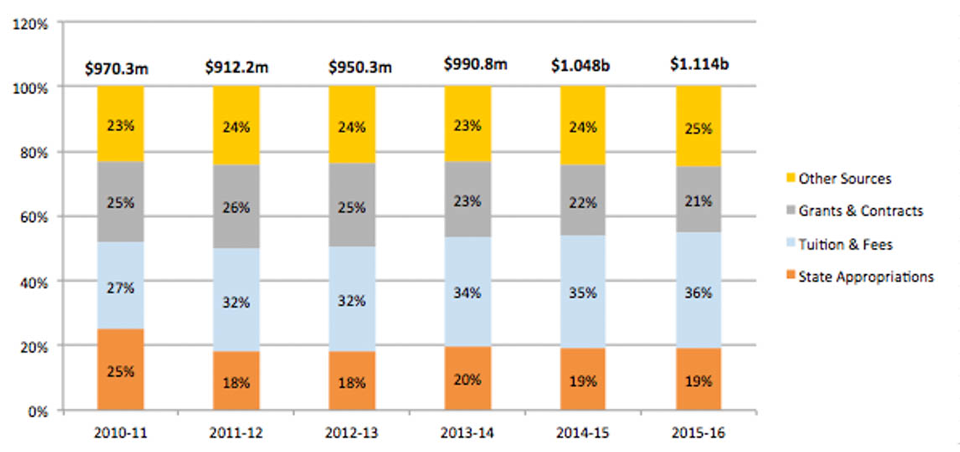
UT Knoxville: Current Revenues by Major Source
As a percent of total revenues, UT Knoxville had a 6% decrease in state appropriation and an 9% increase in Tuition & Fees between FY2011 and FY2016.
| UT Knoxville |
2010 - 11 |
2011 - 12 |
2012 - 13 |
2013 - 14 |
2014 - 15 |
2015 - 16 |
| State Appropriations |
25% |
18% |
18% |
20% |
19% |
19% |
| Tuition & Fees |
27% |
32% |
32% |
34% |
35% |
36% |
| Grants & Contracts |
25% |
26% |
25% |
23% |
22% |
21% |
| Other Sources |
23% |
24% |
24% |
23% |
24% |
25% |
| Definition |
Data Source |
| Total current fund revenues (unrestricted and restricted) by major sources of funds. "Other Sources" includes private gifts, endowment income, sales and services of educational activities, auxiliary, and other sources. "Grants and contracts" includes federal, state, local, and private grants and contracts. | UT Budget Office |
Back to top »
Goal 4. Ensuring Effectiveness and Efficiency
Revenues
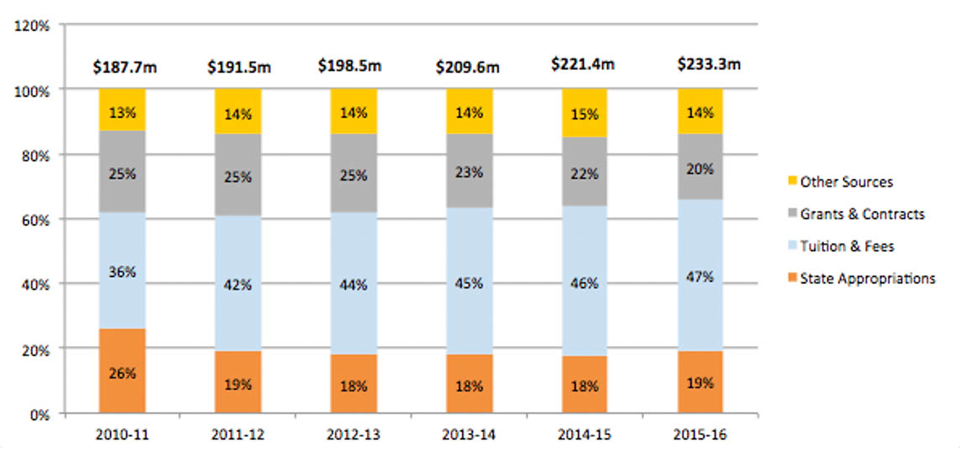
UT Chattanooga: Current Revenues by Major Source
As a percentage of its annual revenues, UT Chattanooga's state appropriations fell by 7%, tuition and fees rose by 11% between FY2011 to FY2016.
| UT Chattanooga |
2010 - 11 |
2011 - 12 |
2012 - 13 |
2013 - 14 |
2014 - 15 |
2015 - 16 |
| State Appropriations |
26% |
19% |
18% |
18% |
18% |
19% |
| Tuition & Fees |
36% |
42% |
44% |
45% |
46% |
47% |
| Grants & Contracts |
25% |
25% |
25% |
23% |
22% |
20% |
| Other Sources |
13% |
14% |
14% |
14% |
15% |
14% |
| Definition |
Data Source |
| Total current fund revenues (unrestricted and restricted) by major sources of funds. "Other Sources" includes private gifts, endowment income, sales and services of educational activities, auxiliary, and other sources. "Grants and contracts" includes federal, state, local, and private grants and contracts. | UT Budget Office |
Back to top »
Goal 4. Ensuring Effectiveness and Efficiency
Revenues
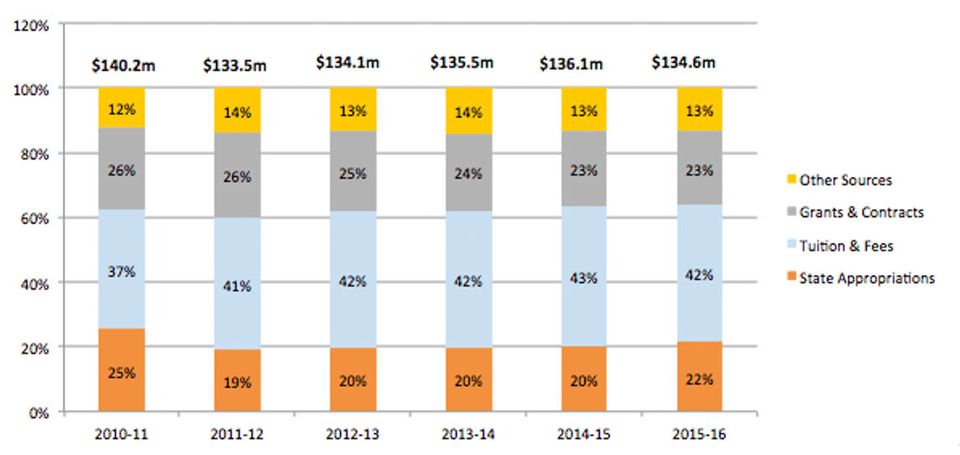
UT Martin: Current Revenues by Major Source
As a percentage of total revenue, UT Martin's state appropriations fell by about 3%, tuition & fees revenue rose about 5% from FY2011 to FY2016.
| UT Martin |
2010 - 11 |
2011 - 12 |
2012 - 13 |
2013 - 14 |
2014 - 15 |
2015 - 16 |
| State Appropriations |
25% |
19% |
20% |
20% |
20% |
22% |
| Tuition & Fees |
37% |
41% |
42% |
42% |
43% |
42% |
| Grants & Contracts |
26% |
26% |
25% |
24% |
23% |
23% |
| Other Sources |
12% |
14% |
13% |
14% |
13% |
13% |
| Definition |
Data Source |
| Total current fund revenues (unrestricted and restricted) by major sources of funds. "Other Sources" includes private gifts, endowment income, sales and services of educational activities, auxiliary, and other sources. "Grants and contracts" includes federal, state, local, and private grants and contracts. | UT Budget Office |
Back to top »
Goal 4. Ensuring Effectiveness and Efficiency
Revenues
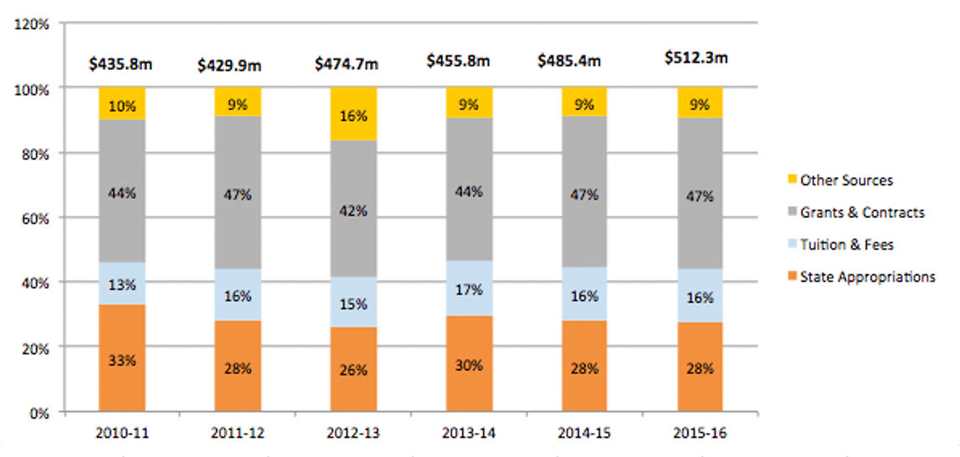
UT Health Science Center: Current Revenues by Major Source
As a percentage of its annual revenues, state appropriations at UTHSC decreased about 5% while tuition & fees percentage rose 3% between FY2011 and FY2016.
| UT Health Science Center |
2010 - 11 |
2011 - 12 |
2012 - 13 |
2013 - 14 |
2014 - 15 |
2015 - 16 |
| State Appropriations |
33% |
28% |
26% |
30% |
28% |
28% |
| Tuition & Fees |
13% |
16% |
15% |
17% |
16% |
16% |
| Grants & Contracts |
44% |
47% |
42% |
44% |
47% |
47% |
| Other Sources |
10% |
9% |
16% |
9% |
9% |
9% |
| Definition |
Data Source |
| Total current fund revenues (unrestricted and restricted) by major sources of funds. "Other Sources" includes private gifts, endowment income, sales and services of educational activities, auxiliary, and other sources. "Grants and contracts" includes federal, state, local, and private grants and contracts. | UT Budget Office |
Back to top »
Goal 4. Ensuring Effectiveness and Efficiency
Revenues
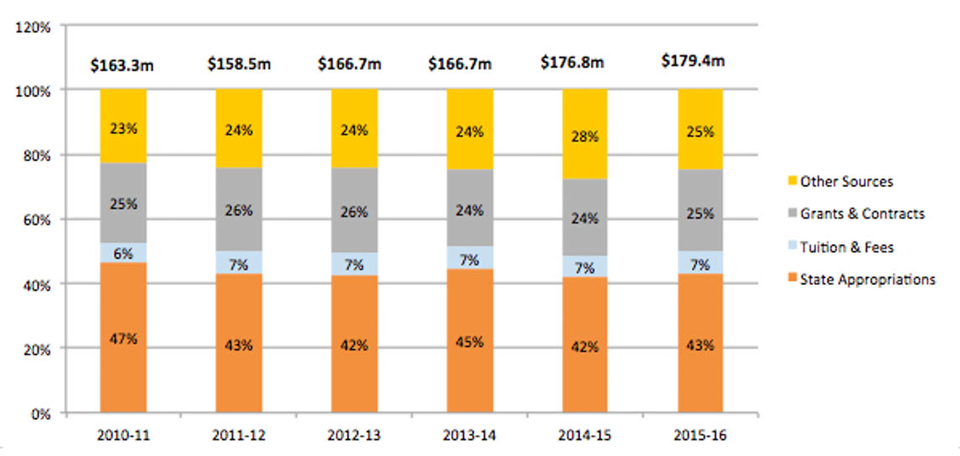
UT Institute of Agriculture: Current Revenues by Major Source
As components of annual revenues from FY2011 to FY2016 at UT Institute of Agriculture, state appropriations fell by 4%, tuition & fees rose 1%, and revenue from other sources rose 2%.
| UT Institute of Agriculture |
2010 - 11 |
2011 - 12 |
2012 - 13 |
2013 - 14 |
2014 - 15 |
2015 - 16 |
| State Appropriations |
47% |
43% |
42% |
45% |
42% |
43% |
| Tuition & Fees |
6% |
7% |
7% |
7% |
7% |
7% |
| Grants & Contracts |
25% |
26% |
26% |
24% |
24% |
25% |
| Other Sources |
23% |
24% |
24% |
24% |
28% |
25% |
| Definition |
Data Source |
| Total current fund revenues (unrestricted and restricted) by major sources of funds. "Other Sources" includes private gifts, endowment income, sales and services of educational activities, auxiliary, and other sources. "Grants and contracts" includes federal, state, local, and private grants and contracts. | UT Budget Office |
Back to top »
Goal 4. Ensuring Effectiveness and Efficiency
Revenues
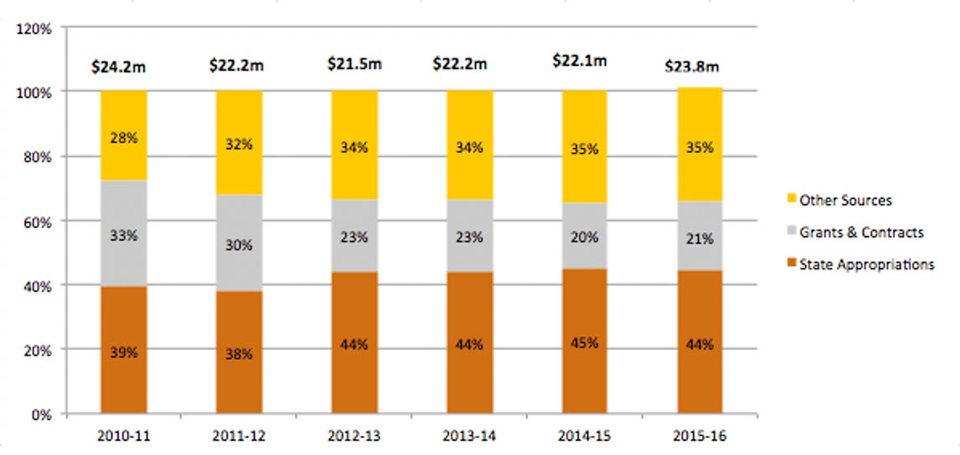
UT Institute for Public Service: Current Revenues by Major Source
As a percent of total revenues between FY2011 and FY2016 at the Institute of Public Service, state appropriations rose 5%, grants & contracts declined 12%, and other sources increased by 7%.
| UT Institute for Public Service |
2010 - 11 |
2011 - 12 |
2012 - 13 |
2013 - 14 |
2014 - 15 |
2015 - 16 |
| State Appropriations |
39% |
38% |
44% |
44% |
45% |
44% |
| Grants & Contracts |
33% |
30% |
23% |
23% |
20% |
21% |
| Other Sources |
28% |
32% |
34% |
34% |
35% |
35% |
| Definition |
Data Source |
| Total current fund revenues (unrestricted and restricted) by major sources of funds. "Other Sources" includes private gifts, endowment income, sales and services of educational activities, auxiliary, and other sources. "Grants and contracts" includes federal, state, local, and private grants and contracts. | UT Budget Office |
Back to top »
Goal 4. Ensuring Effectiveness and Efficiency
Expenditures
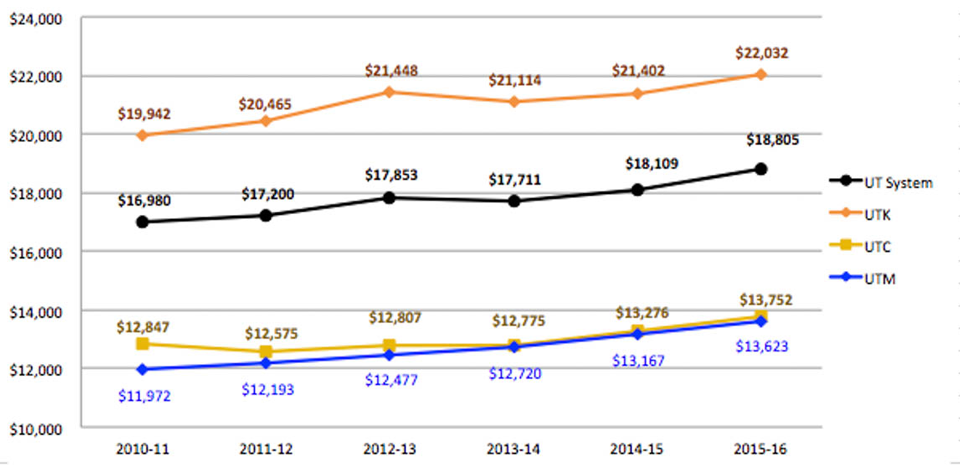
Unrestricted Educational and General (E&G) Expenditures per Student Full-Time Equivalent (FTE) in 2015 dollars
Systemwide, the unrestricted E&G expenditures per student FTE has increased 11% over the last six years.
|
2010 - 11 |
2011 - 12 |
2012 - 13 |
2013 - 14 |
2014 - 15 |
2015 - 16 |
| UT Knoxville |
$19,942 |
$20,465 |
$21,448 |
$21,114 |
$21,402 |
$22,032 |
| UT Chattanooga |
$12,847 |
$12,575 |
$12,807 |
$12,775 |
$13,276 |
$13,752 |
| UT Martin |
$11,972 |
$12,193 |
$12,477 |
$12,720 |
$13,167 |
$13,623 |
| UT System |
$16,980 |
$17,200 |
$17,853 |
$17,711 |
$18,109 |
$18,805 |
| Definition |
Data Source |
| Unrestricted Educational and General (E&G) expense, as reported to THEC, divided by undergraduate and graduate student FTEs. E&G excludes expenses for scholarshps and auxiliary enterprises such as housing, dining, and parking. Dollars are adjusted for inflation using the Higher Education Price Index (HEPI) and shown in 2016 dollars. Student FTE is the number of full-time student equivalents in the fall semester. |
UT Budget Office |
Back to top »
Goal 4. Ensuring Effectiveness and Efficiency
Expenditures
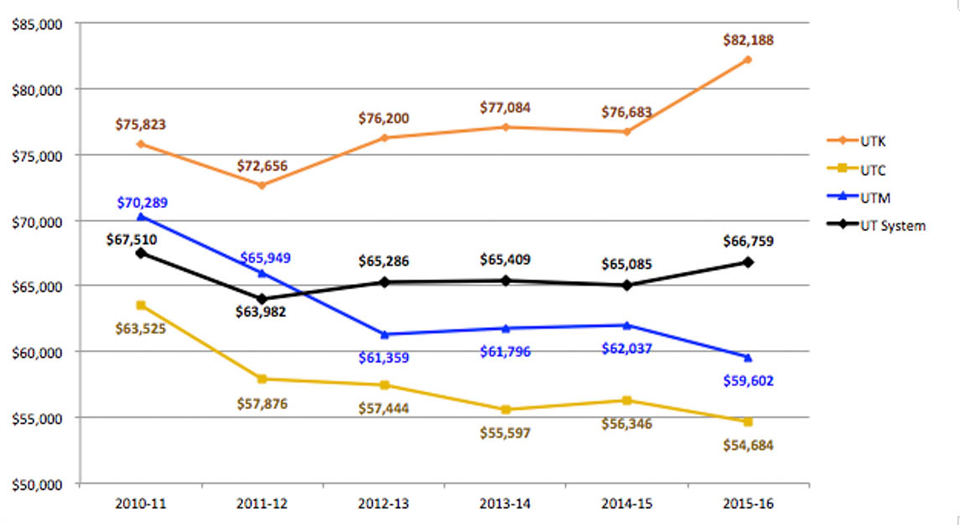
Unrestricted E&G Expense per Degrees Awarded in 2015 Dollars
The unrestricted educational and general expenditures per degree awarded has decreased over 14% over the last six years at UTC and UTM while UTK expenditures per degree has increased 8%.
|
2010 - 11 |
2011 - 12 |
2012 - 13 |
2013 - 14 |
2014 - 15 |
2015 - 16 |
| 3 Campus Average |
$67,510 |
$63,982 |
$65,286 |
$65,409 |
$65,085 |
$66,759 |
| UT Knoxville |
$75,823 |
$72,656 |
$76,200 |
$77,084 |
$76,683 |
$82,188 |
| UT Chattanooga |
$63,525 |
$57,876 |
$57,444 |
$55,597 |
$56,346 |
$54,684 |
| UT Martin |
$70,289 |
$65,949 |
$61,359 |
$61,796 |
$62,037 |
$59,602 |
| Definition |
Data Source |
| Unrestricted Educational and General (E&G) expense, as reported to THEC, divided by undergraduate and graduate student FTEs. E&G excludes expenses for scholarshps and auxiliary enterprises such as housing, dining, and parking. Dollars are adjusted for inflation using the Higher Education Price Index (HEPI) and shown in 2015 dollars. Degreees awarded include all degrees (baccalaureate, masters, doctoral, and professional).
|
UT Financial Schedules and THEC Degrees Awarded File |
Back to top »
Goal 4. Ensuring Effectiveness and Efficiency
Expenditures
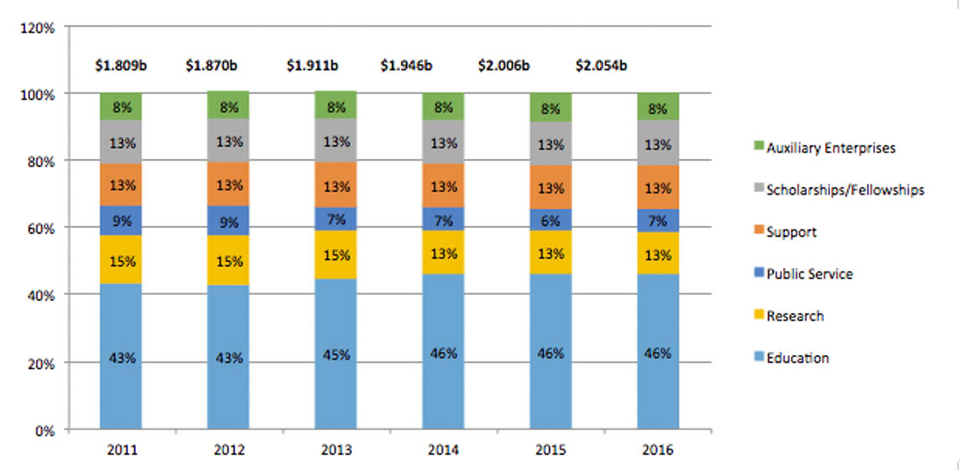
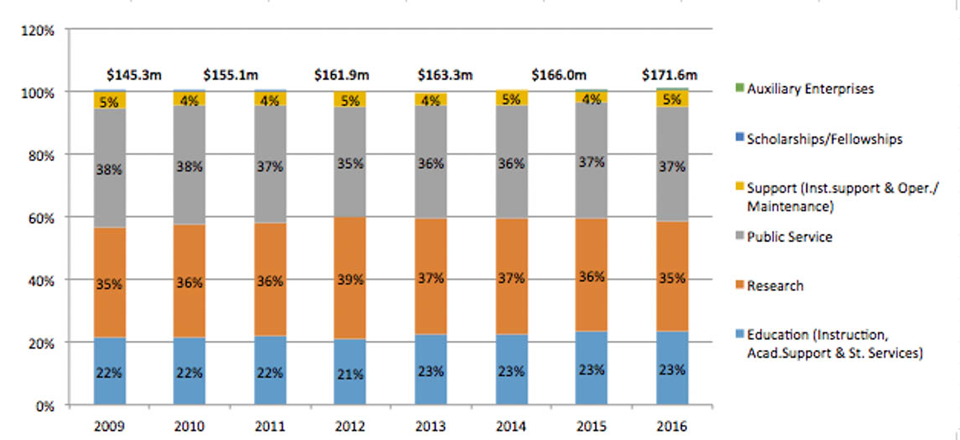
UT System: % of Total Expenditures by Function
Systemwide, Education-related expenditures as a percent of total expenditures increased from 43% to 46% between FY2011 and FY2016. Research and Public Service as a % of Total have both decreased since FY2011.
| Functional Area |
2011 |
2012 |
2013 |
2014 |
2015 |
2016 |
| Education |
43% |
43% |
45% |
46% |
46% |
46% |
| Instruction |
31% |
31% |
32% |
33% |
33% |
32% |
| Academic Support |
8% |
8% |
8% |
9% |
9% |
9% |
| Student Services |
4% |
5% |
5% |
4% |
4% |
5% |
| Research |
15% |
15% |
15% |
13% |
13% |
13% |
| Public Service |
9% |
9% |
7% |
7% |
7% |
7% |
| Support |
13% |
13% |
13% |
13% |
13% |
13% |
| Institutional Support |
6% |
7% |
7% |
7% |
7% |
7% |
| Op/Maint Physical Plant |
7% |
6% |
6% |
6% |
6% |
6% |
| Scholarships/Fellowships |
13% |
13% |
13% |
13% |
13% |
13% |
| Auxiliary Enterprises |
8% |
8% |
8% |
8% |
8% |
8% |
| TOTAL |
100% |
100% |
100% |
100% |
100% |
100% |
| Definition |
Data Source |
| Percentage of total expenditures by functional area as reported annually to THEC. Expenditures include (unrestricted and restricted) educational and general funds and auxiliary funds. | UT Budget Office |
Back to top »
Goal 4. Ensuring Effectiveness and Efficiency
Expenditures
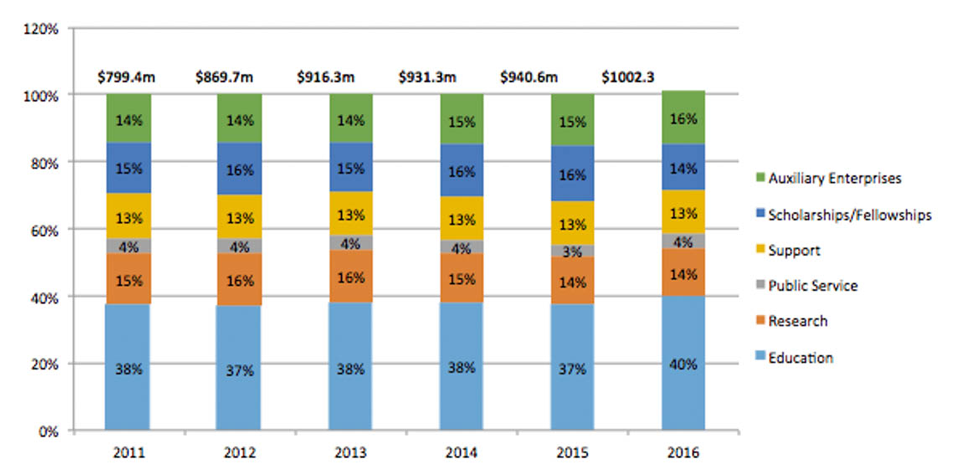
UT Knoxville: % of Total Expenditures by Function
At UT Knoxville, education-related expenditures as a percent of total have increased by two percent over the last six years, while research and scholarships have decreased.
| Functional Area |
2011 |
2012 |
2013 |
2014 |
2015 |
2016 |
| Education |
38% |
37% |
38% |
38% |
38% |
40% |
| Instruction |
24% |
24% |
25% |
25% |
25% |
27% |
| Academic Support |
8% |
8% |
8% |
8% |
7% |
8% |
| Student Services |
5% |
5% |
5% |
5% |
5% |
5% |
| Research |
15% |
16% |
16% |
15% |
14% |
14% |
| Public Service |
4% |
4% |
4% |
4% |
3% |
4% |
| Support |
4% |
13% |
13% |
13% |
13% |
13% |
| Institutional Support |
6% |
6% |
6% |
6% |
6% |
6% |
| Op/Maint Physical Plant |
8% |
7% |
7% |
7% |
7% |
7% |
| Scholarships/Fellowships |
15% |
16% |
15% |
16% |
16% |
14% |
| Auxiliary Enterprises |
14% |
14% |
14% |
15% |
15% |
16% |
| TOTAL |
100% |
100% |
100% |
100% |
100% |
100% |
| Definition |
Data Source |
| Percentage of total expenditures by functional area as reported annually to THEC. Expenditures include (unrestricted and restricted) educational and general funds and auxiliary funds. | UT Budget Office |
Back to top »
Goal 4. Ensuring Effectiveness and Efficiency
Expenditures
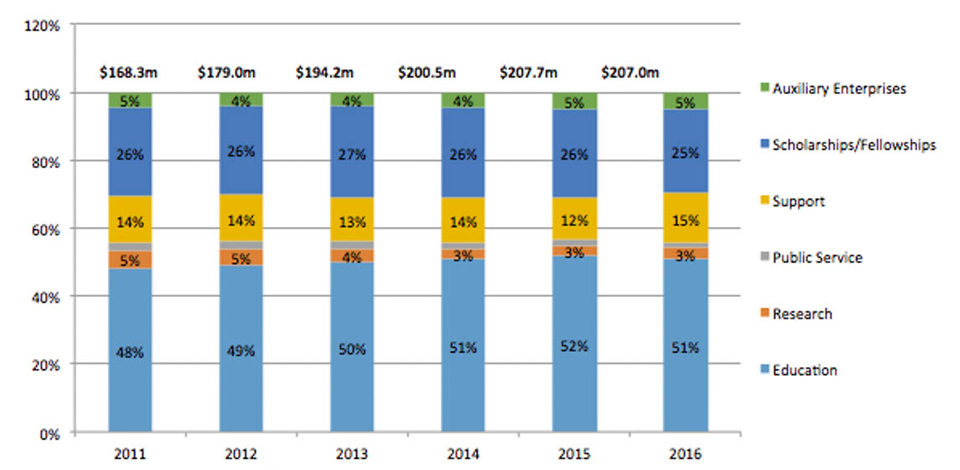
UT Chattanooga: % of Total Expenditures by Function
As a percentage of its annual expenditures, UT Chattanooga's education relatedexpenditures rose while research and support expenditures fell, from FY2011 to FY2016.
| Functional Area |
2011 |
2012 |
2013 |
2014 |
2015 |
2016 |
| Education |
48% |
49% |
50% |
51% |
52% |
51% |
| Instruction |
32% |
31% |
31% |
32% |
32% |
31% |
| Academic Support |
6% |
6% |
7% |
7% |
8% |
8% |
| Student Services |
11% |
12% |
12% |
12% |
12% |
13% |
| Research |
5% |
5% |
4% |
3% |
3% |
3% |
| Public Service |
2% |
2% |
2% |
2% |
2% |
2% |
| Support |
14% |
14% |
13% |
14% |
12% |
15% |
| Institutional Support |
6% |
6% |
6% |
7% |
5% |
7% |
| Op/Maint Physical Plant |
8% |
8% |
7% |
7% |
7% |
8% |
| Scholarships/Fellowships |
26% |
26% |
27% |
26% |
27% |
25% |
| Auxiliary Enterprises |
5% |
4% |
4% |
4% |
5% |
5% |
| TOTAL |
100% |
100% |
100% |
100% |
100% |
100% |
| Definition |
Data Source |
| Percentage of total expenditures by functional area as reported annually to THEC. Expenditures include (unrestricted and restricted) educational and general funds and auxiliary funds. | UT Budget Office |
Back to top »
Goal 4. Ensuring Effectiveness and Efficiency
Expenditures
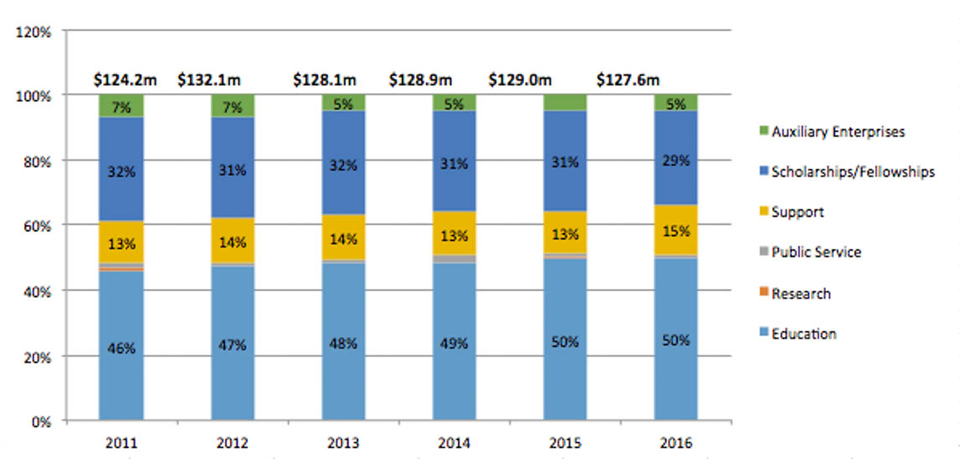
UT Martin: % of Total Expenditures by Function
As a % of total expenditures from FY2011 to FY2016, UT Martin increased its expenditures on education by 4%.
| Functional Area |
2011 |
2012 |
2013 |
2014 |
2015 |
2016 |
| Education |
46% |
47% |
47% |
48% |
50% |
50% |
| Instruction |
29% |
31% |
31% |
31% |
33% |
32% |
| Academic Support |
8% |
8% |
8% |
8% |
8% |
8% |
| Student Services |
8% |
8% |
8% |
9% |
9% |
9% |
| Research |
1% |
0% |
0% |
0% |
0% |
0% |
| Public Service |
2% |
1% |
1% |
2% |
1% |
1% |
| Support |
13% |
13% |
13% |
14% |
13% |
15% |
| Institutional Support |
5% |
5% |
5% |
5% |
5% |
7% |
| Op/Maint Physical Plant |
8% |
8% |
8% |
8% |
8% |
8% |
| Scholarships/Fellowships |
32% |
31% |
32% |
31% |
31% |
29% |
| Auxiliary Enterprises |
7% |
7% |
5% |
5% |
5% |
5% |
| TOTAL |
100% |
100% |
100% |
100% |
100% |
100% |
| Definition |
Data Source |
| Percentage of total expenditures by functional area as reported annually to THEC. Expenditures include (unrestricted and restricted) educational and general funds and auxiliary funds. | UT Budget Office |
Back to top »
Goal 4. Ensuring Effectiveness and Efficiency
Expenditures
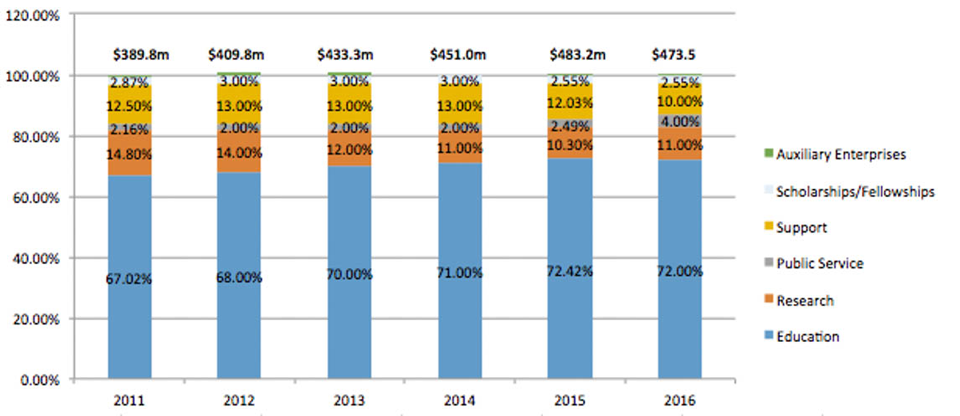
UT Health Science Center: % of Total Expenditures by Function
UT Health Science Center annual expenditures on education related activities has increased by 5%, while expenditures on research decreased by 4% between FY2011 and FY2016.
| Functional Area |
2011 |
2012 |
2013 |
2014 |
2015 |
2016 |
| Education |
67% |
68% |
70% |
71% |
72% |
68% |
| Instruction |
56% |
56% |
57% |
56% |
57% |
50% |
| Academic Support |
10% |
11% |
12% |
13% |
14% |
16% |
| Student Services |
1% |
1% |
1% |
1% |
1% |
1% |
| Research |
15% |
14% |
12% |
11% |
10% |
11% |
| Public Service |
2% |
2% |
2% |
2% |
2% |
4% |
| Support |
13% |
13% |
13% |
13% |
13% |
14% |
| Institutional Support |
6% |
6% |
6% |
6% |
6% |
7% |
| Op/Maint Physical Plant |
7% |
7% |
7% |
6% |
7% |
7% |
| Scholarships/Fellowships |
3% |
3% |
3% |
3% |
3% |
3% |
| Auxiliary Enterprises |
1% |
1% |
1% |
0% |
0% |
0% |
| TOTAL |
100% |
101% |
101% |
98% |
100% |
99% |
| Definition |
Data Source |
| Percentage of total expenditures by functional area as reported annually to THEC. Expenditures include (unrestricted and restricted) educational and general funds and auxiliary funds. | UT Budget Office |
Back to top »
Goal 4. Ensuring Effectiveness and Efficiency
Expenditures
UT Institute of Agriculture: % of Total Expenditures by Function
UT Institute of Agriculture annual expenditures have remained farily constant between F2011 and FY2015.
| Functional Area |
2011 |
2012 |
2013 |
2014 |
2015 |
2016 |
| Education |
22% |
21% |
22% |
23% |
23% |
23% |
| Instruction |
18% |
17% |
17% |
18% |
18% |
18% |
| Academic Support |
4% |
4% |
5% |
5% |
5% |
5% |
| Student Services |
0% |
0% |
0% |
0% |
0% |
0% |
| Research |
36% |
39% |
36% |
37% |
36% |
35% |
| Public Service |
37% |
35% |
36% |
36% |
36% |
37% |
| Support |
4% |
5% |
4% |
5% |
4% |
5% |
| Institutional Support |
2% |
3% |
2% |
2% |
3% |
3% |
| Op/Maint Physical Plant |
2% |
2% |
2% |
2% |
2% |
2% |
| Scholarships/Fellowships |
0% |
0% |
0% |
0% |
0% |
0% |
| Auxiliary Enterprises |
0% |
0% |
0% |
0% |
0% |
0% |
| TOTAL |
100% |
100% |
99% |
100% |
100% |
100% |
| Definition |
Data Source |
| Percentage of total expenditures by functional area as reported annually to THEC. Expenditures include (unrestricted and restricted) educational and general funds and auxiliary funds. | UT Budget Office |
Back to top »
Goal 4. Ensuring Effectiveness and Efficiency
Expenditures
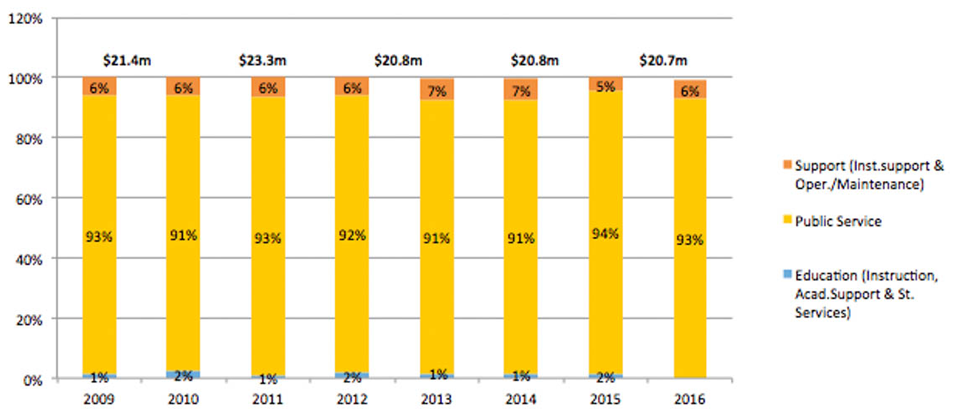
UT Institute for Public Service: % of Total Expenditures by Function
UT Institute of Public Service annual expenditures remained relatively constant in spending percentage by major functions from FY2011 to FY2015.
| Functional Area |
2011 |
2012 |
2013 |
2014 |
2015 |
2016 |
| Education |
1% |
2% |
1% |
1% |
2% |
1% |
| Instruction |
0% |
1% |
0% |
0% |
0% |
0% |
| Academic Support |
1% |
1% |
1% |
1% |
1% |
1% |
| Student Services |
0% |
0% |
0% |
0% |
0% |
0% |
| Research |
0% |
0% |
0% |
0% |
0% |
0% |
| Public Service |
93% |
92% |
91% |
91% |
94% |
93% |
| Support |
6% |
6% |
7% |
7% |
5% |
6% |
| Institutional Support |
6% |
6% |
7% |
7% |
6% |
6% |
| Op/Maint Physical Plant |
0% |
0% |
0% |
0% |
0% |
0% |
| Scholarships/Fellowships |
0% |
0% |
0% |
0% |
0% |
0% |
| Auxiliary Enterprises |
0% |
0% |
0% |
0% |
0% |
0% |
| TOTAL |
100% |
100% |
99% |
99% |
99% |
100% |
| Definition |
Data Source |
| Percentage of total expenditures by functional area as reported annually to THEC. Expenditures include (unrestricted and restricted) educational and general funds and auxiliary funds. | UT Budget Office |
Back to top »
Goal 4. Ensuring Effectiveness and Efficiency
Advancement
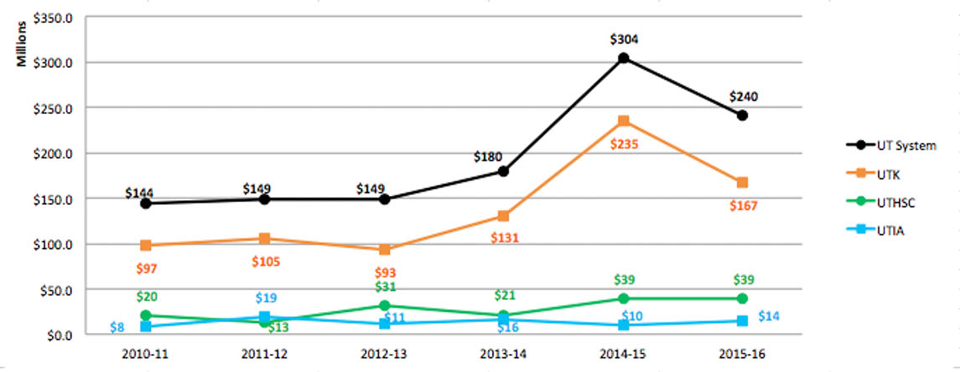
Total Gifts, Payments, Pledges, and Bequests ($ in Millions)
Systemwide, total giving has increased by 67% between 2010-11 and 2015-16.
| |
2010-11 |
2011-12 |
2012-13 |
2013-14 |
2014-15 |
2015-16 |
| UT System |
$144,053,061 |
$148,998,295 |
$149,133,945 |
$179,787,616 |
$303,746,886 |
$240,261,441 |
| UT Knoxville |
$97,190,310 |
$104,782,172 |
$92,690,173 |
$130,870,991 |
$234,527,744 |
$167,211,254 |
| UT Chattanooga |
$10,889,684 |
$8,656,965 |
$10,046,298 |
$6,375,134 |
$14,484,112 |
$15,059,187 |
| UT Martin |
$4,519,166 |
$3,045,309 |
$3,285,199 |
$3,110,931 |
$3,879,841 |
$4,248,274 |
| UT Health Science Center |
$20,427,757 |
$12,878,866 |
$30,876,560 |
$21,283,678 |
$39,248,141 |
$38,948,241 |
| UT Institute of Agriculture |
$8,296,148 |
$18,800,171 |
$10,954,190 |
$16,037,676 |
$10,415,971 |
$14,228,148 |
| UT Institute for Public Service |
$1,335,306 |
$156,481 |
$586,295 |
$171,186 |
$143,030 |
$70,705 |
| Definition |
Data Source |
| The total number of gifts, payments, and bequests to the University during the fiscal year (July 1 to June 30). | University of Tennessee Foundation |
Back to top »
Goal 4. Ensuring Effectiveness and Efficiency
Advancement
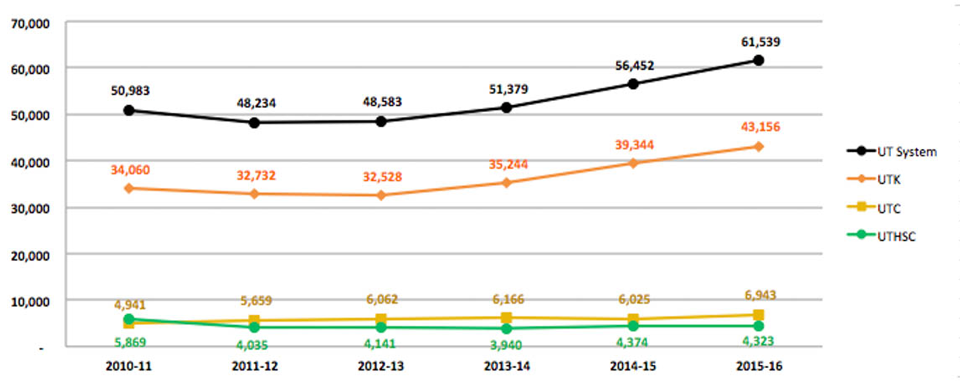
Total Number of Donors
Systemwide, the total number of donors has increased by 21% over the last six years.
| |
2010-11 |
2011-12 |
2012-13 |
2013-14 |
2014-15 |
2015-16 |
| UT System |
50,983 |
48,234 |
48,583 |
51,379 |
56,452 |
61,539 |
| UT Knoxville |
34,060 |
32,732 |
32,528 |
35,244 |
39,344 |
43,156 |
| UT Chattanooga |
4,941 |
5,659 |
6,062 |
6,166 |
6,025 |
6,943 |
| UT Martin |
2,447 |
2,440 |
2,702 |
3,032 |
3,535 |
3,883 |
| UT Health Science Center |
5,869 |
4,035 |
4,141 |
3,940 |
4,374 |
4,323 |
| UT Institute of Agriculture |
2,987 |
2,872 |
3,019 |
3,359 |
3,311 |
3,799 |
| UT Institute for Public Service |
125 |
153 |
102 |
148 |
148 |
141 |
| Definition |
Data Source |
| The total number of individuals who donated any gifts, payments, and bequests to the University during the fiscal year (July 1 to June 30). | University of Tennessee Foundation |
Back to top »
Goal 4. Ensuring Effectiveness and Efficiency
Advancement
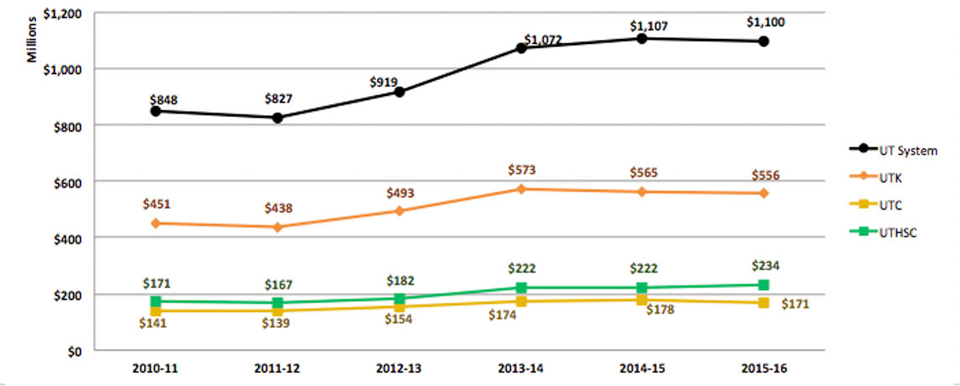
Endowment Value (in Millions)
The market value of the endowment for the system exceeds $1.1 billion dollars
| |
2010-11 |
2011-12 |
2012-13 |
2013-14 |
2014-15 |
2015-16 |
| UT System |
$848,328,583 |
$826,701,196 |
$919,407,916 |
$1,071,999,837 |
$1,106,924,391 |
$1,099,633,820 |
| UT Knoxville |
$450,855,668 |
$438,189,227 |
$493,266,946 |
$572,756,022 |
$565,020,778 |
$556,100,016 |
| UT Chattanooga |
$141,064,863 |
$139,345,936 |
$154,334,008 |
$174,237,886 |
$178,434,207 |
$171,147,519 |
| UT Martin |
$36,163,576 |
$34,962,153 |
$38,591,350 |
$43,689,103 |
$43,285,497 |
$41,319,674 |
| UT Health Science Center |
$171,486,437 |
$167,018,261 |
$181,949,144 |
$221,802,081 |
$221,782,820 |
$233,993,760 |
| UT Institute of Agriculture |
$48,697,478 |
$47,243,312 |
$52,613,347 |
$62,444,389 |
$64,509,847 |
$62,402,031 |
| UT Institute for Public Service |
$7,746,246 |
$7,533,921 |
$8,761,830 |
$9,827,851 |
$10,095,911 |
$12,060,800 |
| Definition |
Data Source |
| Market value of the endowment as of June 30 of each year. | University of Tennessee Foundation |
Back to top »
Goal 4. Ensuring Effectiveness and Efficiency
Advancement
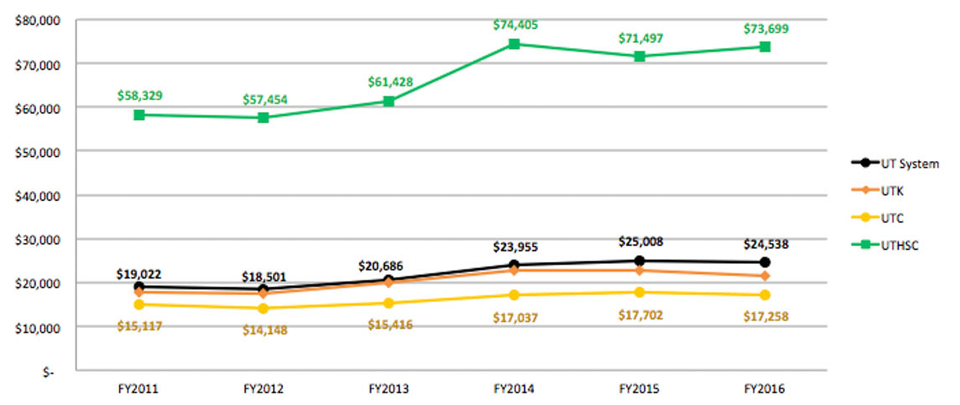
Endowment Dollars per Student FTE ($K)
Systemwide, total endowment funds per student full-time equivalent (FTE) increased approximatly $6,000 per student between FY2011 and 2016.
| |
FY 2011 |
FY 2012 |
FY 2013 |
FY 2014 |
FY 2015 |
FY 2016 |
| UT System |
$19,022 |
$18,501 |
$20,686 |
$23,955 |
$25,008 |
$24,538 |
| UT Knoxville |
$17,771 |
$17,468 |
$19,950 |
$22,907 |
$22,779 |
$21,615 |
| UT Chattanooga |
$15,117 |
$14,148 |
$15,416 |
$17,037 |
$17,702 |
$17,258 |
| UT Martin |
$5,198 |
$5,110 |
$5,720 |
$6,681 |
$6,897 |
$6,894 |
| UT Health Science Center |
$60,446 |
$59,205 |
$63,199 |
$78,514 |
$71,497 |
$73,699 |
| UT Institute of Agriculture |
$29,912 |
$26,349 |
$29,658 |
$32,676 |
$32,015 |
$29,681 |
| Definition |
Data Source |
| Market value of the endowment as of June 30 of each year divided by the number of full-time student equivalents (FTE) in the fall semester. | University of Tennessee Foundation |
Back to top »
Goal 4. Ensuring Effectiveness and Efficiency
Assets and Facilities
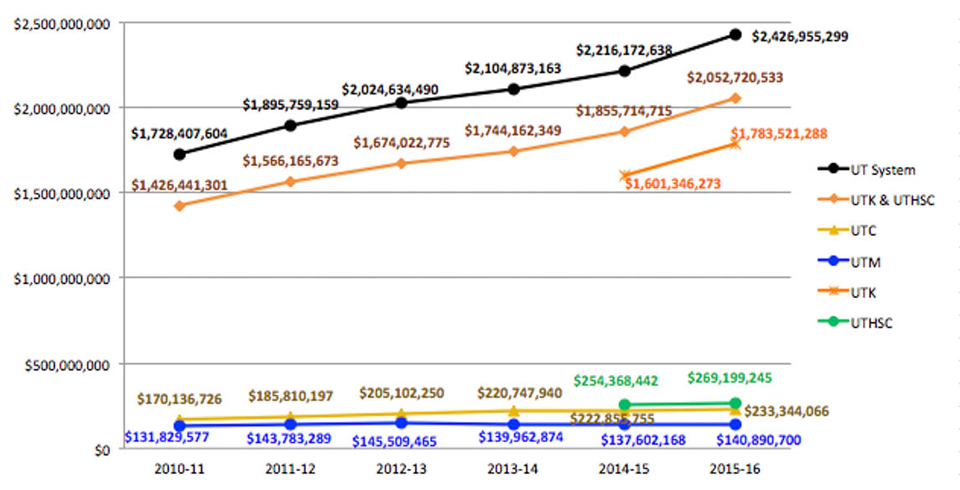
Capital Assets
Systemwide, capital assets have increased 40% from FY2011 to FY2016.
| |
2010-11 |
2011-12 |
2012-13 |
2013-14 |
2014-15 |
2015-16 |
| UT System |
$1,728,407,604 |
$1,895,759,159 |
$2,024,634,490 |
$2,104,873,163 |
$2,216,172,638 |
$2,426,955,299 |
| UT Knoxville & UT Health Science Center (combined) |
$1,426,441,301 |
$1,566,165,673 |
$1,674,022,775 |
$1,744,162,349 |
$1,855,714,715 |
$2,052,720,533 |
| UT Chattanooga |
$170,136,726 |
$185,810,197 |
$205,102,250 |
$220,747,940 |
$222,855,755 |
$233,344,066 |
| UT Martin |
$131,829,577 |
$143,783,289 |
$145,509,465 |
$139,962,874 |
$137,602,168 |
$140,890,700 |
| UT Knoxville |
– |
– |
– |
– |
$1,601,346,273 |
$1,783,521,288 |
| UT Health Science Center |
– |
– |
– |
– |
$254,368,442 |
$269,199,245 |
| Definition |
Data Source |
| Capital assets include land, buildings, vehicles, equipment, and infrastructure as reported to the federal government. Capital assets include improvements and reductions for accumulated depreciation. | Integrated Post-Secondary Educational Data System (IPEDS) Finance Form. |
Back to top »
Goal 4. Ensuring Effectiveness and Efficiency
Assets and Facilities
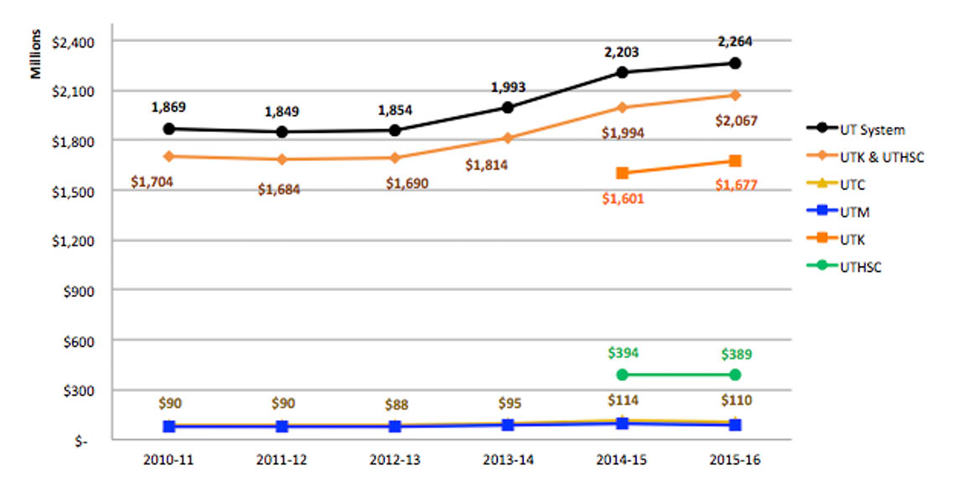
Non-capital Assets
Systemwide, non-capital assets have increased by about 21%, from FY2011 to FY2016.
| |
2010-11 |
2011-12 |
2012-13 |
2013-14 |
2014-15 |
2015-16 |
| UT System |
$1,869,151,746 |
$1,849,079,851 |
$1,854,010,348 |
$1,992,534,390 |
$2,202,921,184 |
$2,263,994,966 |
| UT Knoxville & UT Health Science Center (combined) |
$1,704,464,893 |
$1,684,023,950 |
$1,689,550,768 |
$1,813,628,203 |
$1,994,161,154 |
$2,066,535,318 |
| UT Chattanooga |
$89,890,454 |
$89,579,989 |
$87,755,249 |
$95,222,440 |
$113,797,535 |
$109,896,793 |
| UT Martin |
$74,796,399 |
$75,475,912 |
$76,704,331 |
$83,683,747 |
$94,962,495 |
$87,562,855 |
| UT Knoxville |
– |
– |
– |
– |
$1,600,520,503 |
$1,677,223,769 |
| UT Health Science Center |
– |
– |
– |
– |
$393,640,651 |
$389,311,549 |
| Definition |
Data Source |
| Non-Capital Assets is based on the Total Assets minus the Capital Assets as reported to the federal government. |
Integrated Post-Secondary Educational Data System (IPEDS) Finance Form. |
Back to top »
Goal 4. Ensuring Effectiveness and Efficiency
Assets and Facilities
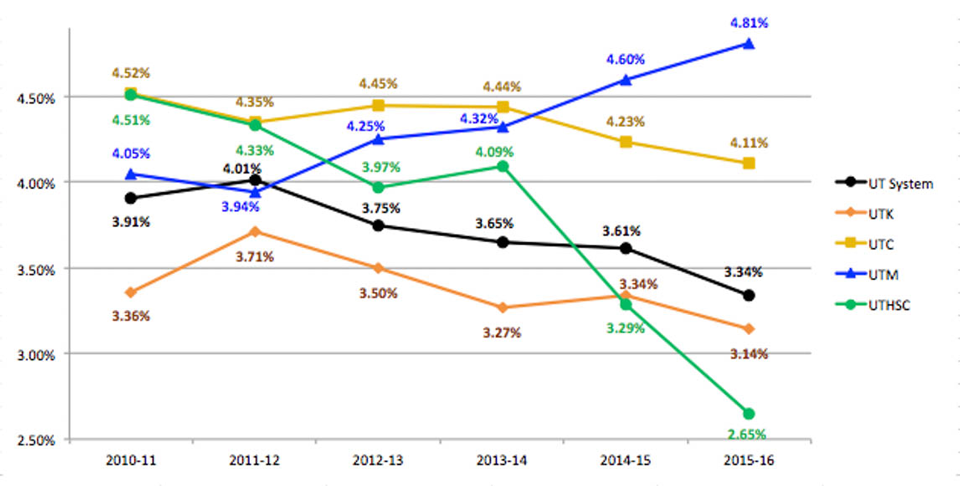
Current Net Assets as % of Current Expense
The current net assets (rainy day fund) as a percentage of current expenses hit its 3% to 5% target range on each campus except at UTHSC for FY2016.
| |
2010-11 |
2011-12 |
2012-13 |
2013-14 |
2014-15 |
2015-16 |
| UT System |
3.91% |
4.01% |
3.75% |
3.65% |
3.61% |
3.34% |
| UT Knoxville |
3.36% |
3.71% |
3.50% |
3.27% |
3.34% |
3.14% |
| UT Chattanooga |
4.52% |
4.35% |
4.45% |
4.44% |
4.23% |
4.11% |
| UT Martin |
4.05% |
3.94% |
4.25% |
4.32% |
4.60% |
4.81% |
| UT Health Science Center |
4.51% |
4.33% |
3.97% |
4.09% |
3.29% |
2.65% |
| UT Institute of Agriculture |
4.53% |
3.99% |
3.11% |
3.22% |
3.79% |
3.76% |
| UT Institute for Public Service |
3.71% |
3.87% |
4.00% |
3.81% |
4.09% |
3.93% |
| Definition |
Data Source |
| This chart represents the unrestricted Educational & General net assets divided by the total Expenditures and Transfers. The percentage is often thought as the "Rainy Day" fund. The recommended ratio is 2% to 5%. UTK does not include Vet Med or CASNR. | UT Budget Office |
Back to top »
Goal 4. Ensuring Effectiveness and Efficiency
Assets and Facilities
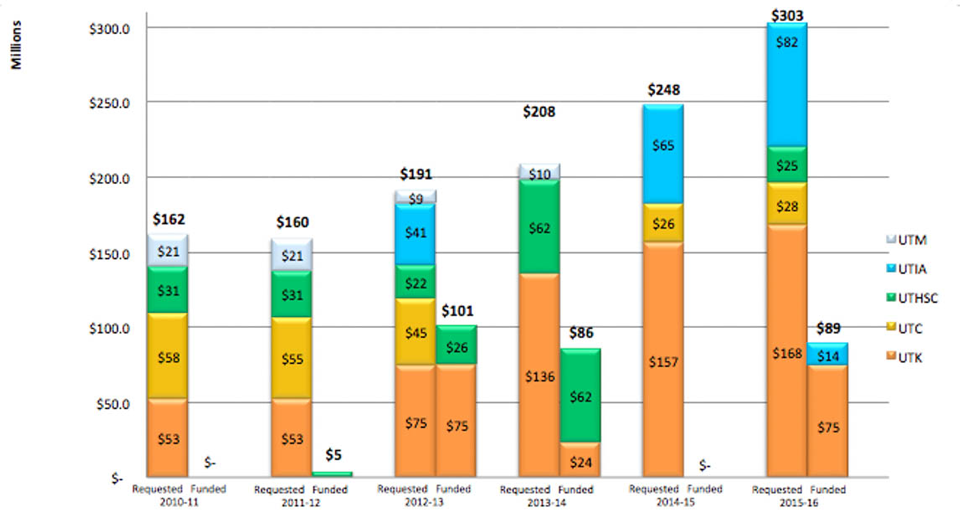
Capital outlay (State-Funded New Construction and Renovation Dollars in Millions)
In 2015-16, UT received $89 million in state funding for new construction and renovation projects.
| Definition |
Data Source |
| Capital Outlay represents the amount of funds requested and approved by the Tennessee General Assembly for new construction, and major renovations. These amounts reflect only the state-funded portion of the projects and do not include matching funds. |
UT Office of Facilities Planning |
Back to top »
Goal 4. Ensuring Effectiveness and Efficiency
Assets and Facilities
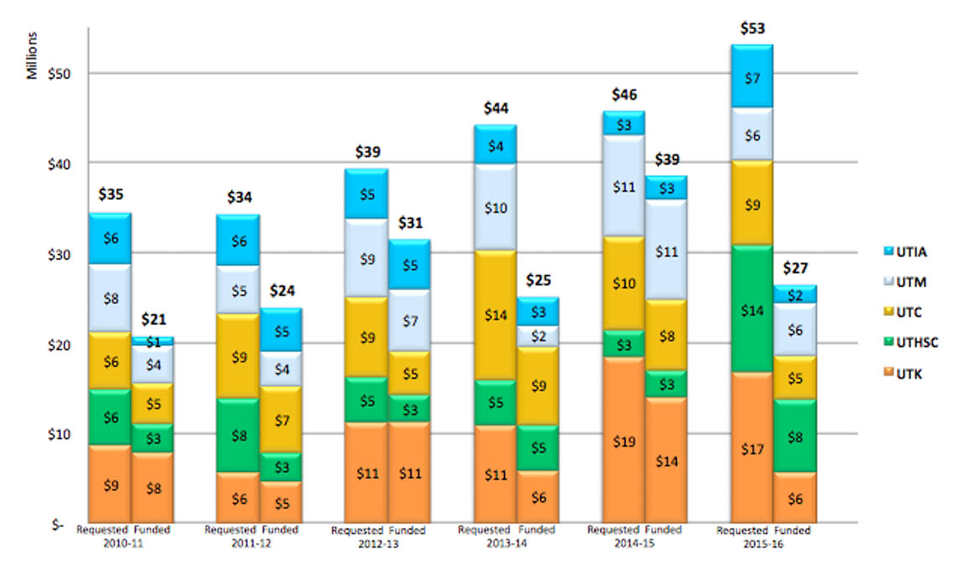
Maintenance Funded
Systemwide, maintenance dollars funded as a percent of amount requested averaged around 67% from FY2011 to FY2016, with a high of about 85% in FY2015 and a low of 50% in FY2016
| Definition |
Data Source |
| This chart represents the amount of funds requested and approved by the Tennessee General Assembly for capital maintenance to protect the integrity of the building structures or bring the equipment or systems in the buildings into compliance with current federal, state and local standards. These amounts reflect only the state-funded portion of the projects. |
UT Office of Facilities Planning |
Back to top »
Goal 4. Ensuring Effectiveness and Efficiency
Assets and Facilities
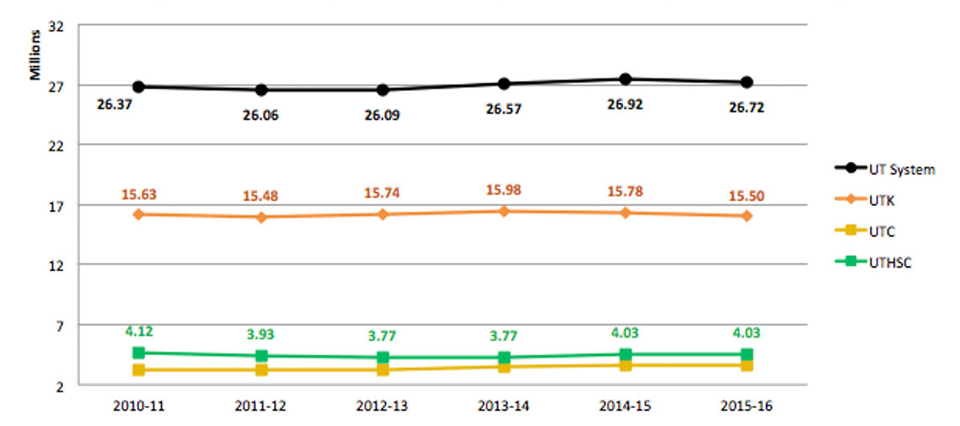
Gross Square Footage
Systemwide, gross square footage of total facilities has remained farily constant with around 27 million square feet.
| |
2010-11 |
2011-12 |
2012-13 |
2013-14 |
2014-15 |
2015-16 |
| UT System Total |
26,372,689 |
26,058,836 |
26,089,141 |
26,570,559 |
26,917,416 |
26,724,671 |
| UT Knoxville |
15,628,324 |
15,479,205 |
15,736,555 |
15,982,944 |
15,783,256 |
15,502,566 |
| UT Chattanooga |
2,708,135 |
2,732,521 |
2,712,077 |
2,987,957 |
3,172,682 |
3,145,682 |
| UT Martin |
2,431,545 |
2,431,545 |
2,450,526 |
2,493,647 |
2,478,177 |
2,478,177 |
| UT Health Science Center |
4,119,200 |
3,932,066 |
3,772,866 |
3,772,866 |
4,026,308 |
4,026,308 |
| UT Institute of Agriculture |
1,796,821 |
1,787,210 |
1,834,572 |
1,749,931 |
1,851,445 |
1,966,390 |
| Definition |
Data Source |
| Gross square footage represents the total square feet of areas within the exterior walls of the building for all stories or areas that house floor surfaces. | UT Facilities Space Inventory |
Back to top »
Goal 4. Ensuring Effectiveness and Efficiency
Assets and Facilities
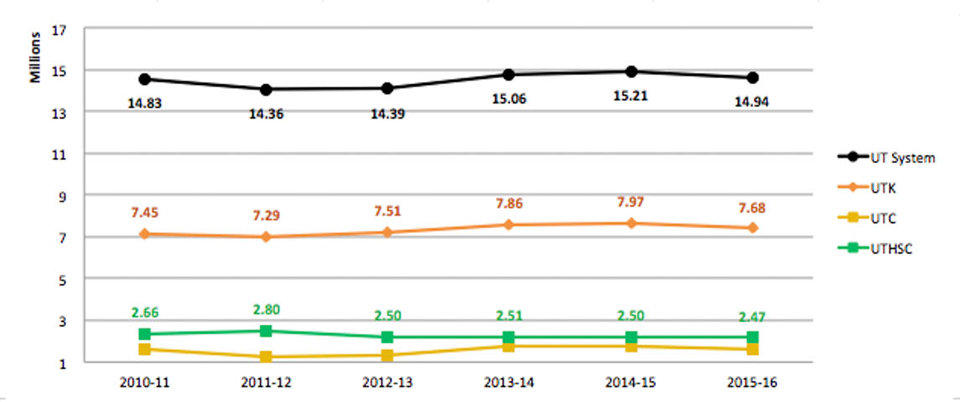
Net Educational & General Square Footage
Systemwide, educational and general square footage of total facilities has remained farily constant with around 15 million square feet.
| |
2010-11 |
2011-12 |
2012-13 |
2013-14 |
2014-15 |
2015-16 |
| UT System Total |
14,833,185 |
14,360,627 |
14,387,900 |
15,062,688 |
15,213,101 |
14,937,736 |
| UT Knoxville |
7,454,928 |
7,288,756 |
7,512,088 |
7,864,333 |
7,970,478 |
7,683,767 |
| UT Chattanooga |
1,917,716 |
1,531,196 |
1,616,212 |
2,026,586 |
2,023,823 |
1,941,875 |
| UT Martin |
1,425,206 |
1,345,152 |
1,344,777 |
1,348,310 |
1,277,215 |
1,280,768 |
| UT Health Science Center |
2,658,690 |
2,803,823 |
2,498,066 |
2,505,569 |
2,499,805 |
2,466,497 |
| UT Institute of Agriculture |
1,687,981 |
1,695,411 |
1,834,212 |
1,734,676 |
1,837,016 |
1,959,281 |
| Definition |
Data Source |
| E&G square footage represents the gross square footage dedicated to educational and general (E&G) functions on each campus/institute and exclude auxiliary (e.g., residence halls, dining facilities, etc.) and hospital space. |
UT Facilities Space Inventory |
Back to top »
Goal 4. Ensuring Effectiveness and Efficiency
Assets and Facilities
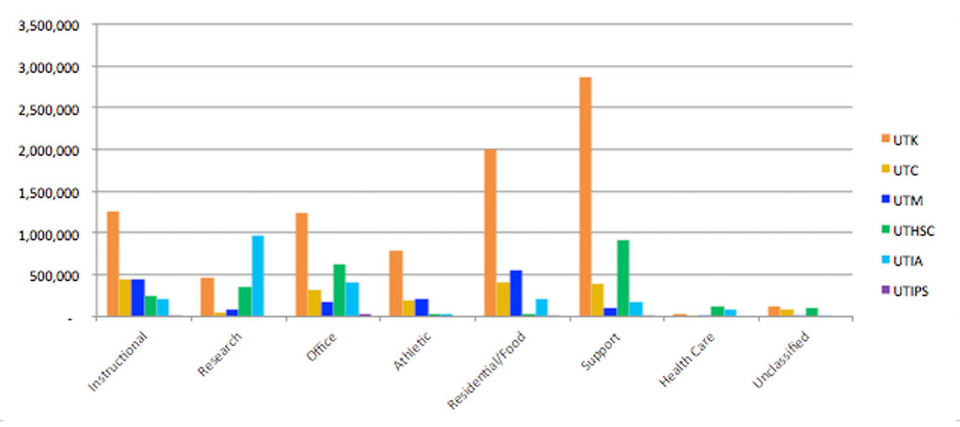
Assignable Square Feet by Type of Space for 2014-15
Total assignable square feet of facilities by the type of usage of space varies across UT System, which is reflective of the campus' different missions.
| |
UTK |
UTC |
UTM |
UTHSC |
UTIA |
UTIPS |
| Instructional |
1,254,795 |
442,249 |
442,161 |
249,884 |
208,424 |
5,538 |
| Research |
473,307 |
44,941 |
81,997 |
355,242 |
967,298 |
– |
| Office |
1,243,379 |
317,022 |
182,429 |
635,565 |
402,915 |
37,153 |
| Athletic |
785,178 |
199,055 |
216,819 |
38,700 |
27,485 |
– |
| Residential/Food |
2,007,347 |
406,324 |
551,013 |
38,459 |
219,956 |
642 |
| Support |
2,863,671 |
390,089 |
98,431 |
912,114 |
173,808 |
3,195 |
| Health Care |
23,914 |
1,302 |
3,215 |
126,687 |
91,911 |
– |
| Unclassified |
126,848 |
82,238 |
785 |
96,038 |
8,763 |
– |
| Total |
8,778,439 |
1,883,220 |
1,576,850 |
2,452,689 |
2,100,560 |
46,528 |
| Definition |
Data Source |
| Assignable square feet represents sum of all areas on all floors of a building assigned to, or available for assignment to, an occupant or specific use and excludes walls, stairways, corridors, restrooms, parking facilities, or mechanical space. |
UT Facilities Space Inventory |
Back to top »
Goal 4. Improving Effectiveness & Efficiency
Human Resources
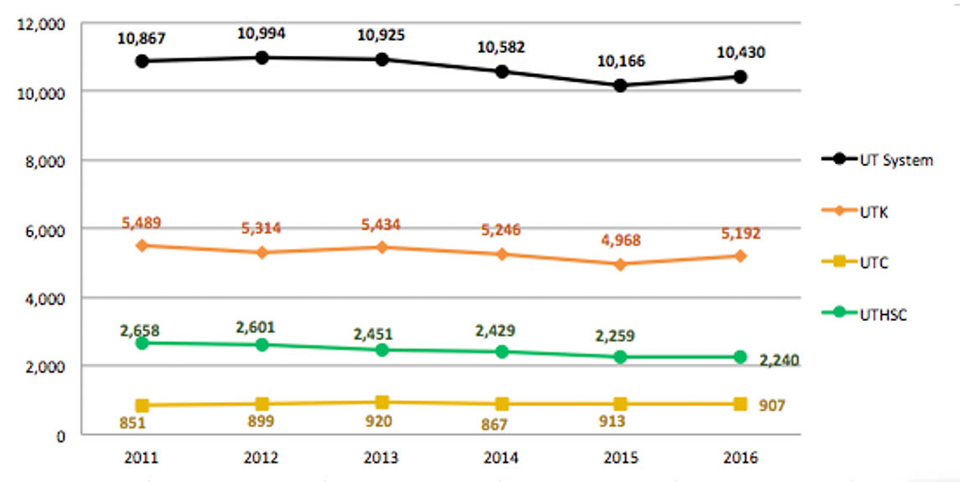
Staff Employees - Number of Staff
Systemwide, the number of employees classified as staff has decreased by 4% from 2011 to 2016.
|
2011 |
2012 |
2013 |
2014 |
2015 |
2016 |
| UT System |
10,867 |
10,994 |
10,925 |
10,582 |
10,166 |
10,430 |
| UT Knoxville |
5,489 |
5,314 |
5,434 |
5,246 |
4,968 |
5,192 |
| UT Chattanooga |
851 |
899 |
920 |
867 |
913 |
907 |
| UT Martin |
590 |
590 |
584 |
569 |
562 |
548 |
| UT Health Science Center |
2,658 |
2,601 |
2,451 |
2,429 |
2,259 |
2,240 |
| UT Institute of Agriculture |
1,336 |
1,359 |
1,329 |
1,275 |
1,278 |
1,358 |
| UT Institute for Public Service |
181 |
179 |
169 |
170 |
153 |
172 |
| Definition |
Data Source |
| Represents the total number of paid, regular (permanent) and term (temporary) employees who are not classified as faculty in IRIS. UT Knoxville staff includes staff in the Space Institute and staff in the College of Veterinary Medicine, as of Nov. 1 each year. | IRIS Human Resource Business Warehouse Report |
Back to top »
Goal 4. Improving Effectiveness & Efficiency
Human Resources
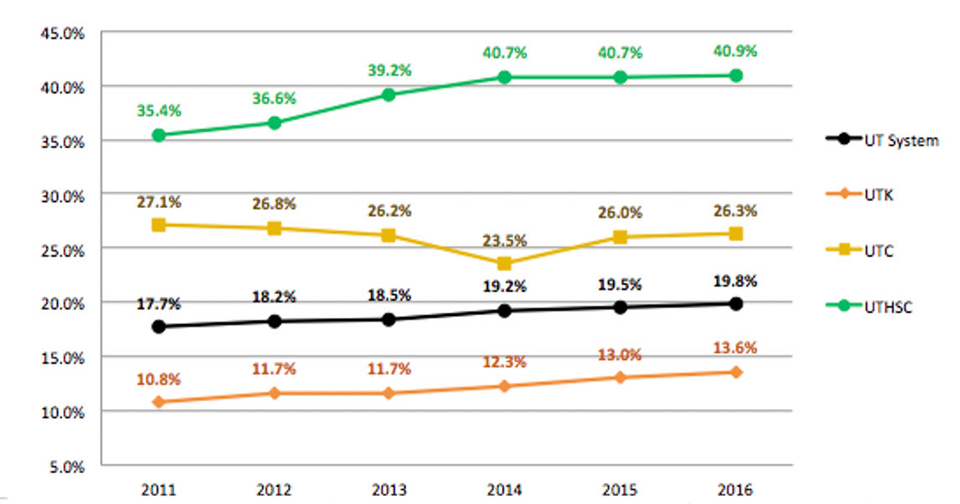
Staff Employees - Percent of Staff that are Minority
Systemwide, the percentage of staff who are minority has increased about 2 percentage points since 2011.
|
2011 |
2012 |
2013 |
2014 |
2015 |
2016 |
| UT System Average |
17.7% |
18.2% |
18.5% |
19.2% |
19.5% |
19.8% |
| UT Knoxville |
10.8% |
11.7% |
11.7% |
12.3% |
13.0% |
13.6% |
| UT Chattanooga |
27.1% |
26.8% |
26.2% |
23.5% |
26.0% |
26.3% |
| UT Martin |
11.0% |
9.1% |
9.6% |
10.0% |
11.1% |
11.2% |
| UT Health Science Center |
35.4% |
36.6% |
39.2% |
40.7% |
40.7% |
40.9% |
| UT Institute of Agriculture |
7.0% |
7.4% |
7.3% |
8.3% |
7.4% |
8.2% |
| UT Institute for Public Service |
9.4% |
12.2% |
11.2% |
8.8% |
9.2% |
9.4% |
| Definition |
Data Source |
| Represents percentage of the total paid, regular (permanent) and term (temporary) staff who are classified as minority. Minority staff includes African American, Hispanic, Native American Indian, Asian, and multiracial. | IRIS Human Resource Business Warehouse Report |
Back to top »
Goal 4. Improving Effectiveness & Efficiency
Human Resources
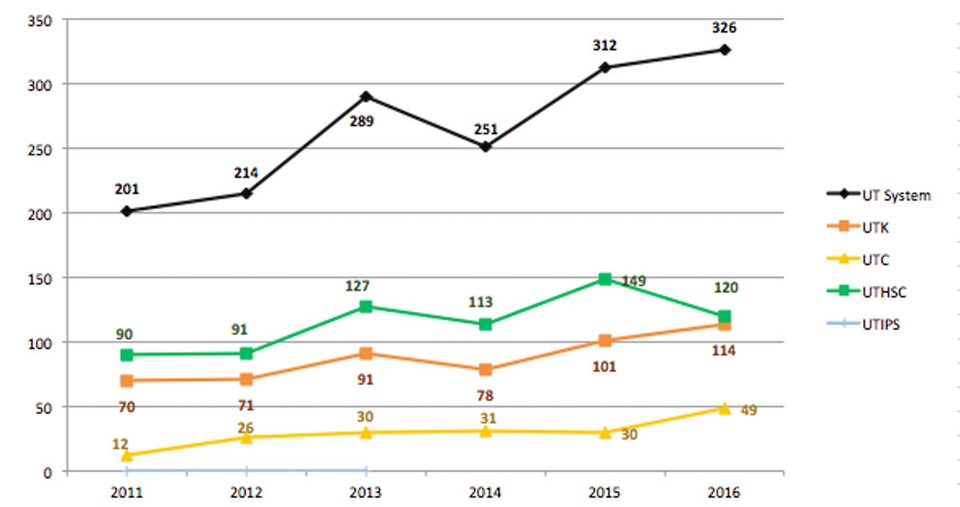
Recruitment - New Hire Permanent Faculty
Systemwide, the number of permanent faculty new hires increased by 62% between 2011 to 2016.
|
2011 |
2012 |
2013 |
2014 |
2015 |
2016 |
| UT System Total |
201 |
214 |
289 |
251 |
312 |
326 |
| UT Knoxville |
70 |
71 |
91 |
78 |
101 |
114 |
| UT Chattanooga |
12 |
26 |
30 |
31 |
30 |
49 |
| UT Martin |
16 |
14 |
22 |
13 |
24 |
27 |
| UT Health Science Center |
90 |
91 |
127 |
113 |
149 |
120 |
| UT Institute of Agriculture |
13 |
12 |
19 |
16 |
16 |
16 |
| Definition |
Data Source |
| Represents the total number of regular (permanent) faculty who were classified as New Hires from November 1 to October 31 of year reported. |
IRIS Human Resource Business Warehouse Report |
Back to top »
Goal 4. Improving Effectiveness & Efficiency
Human Resources
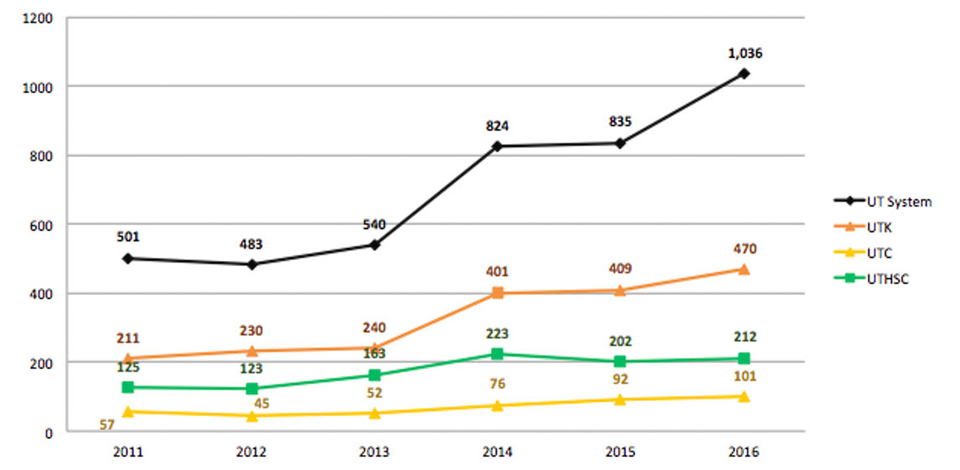
Recruitment - New Hire Permanent Staff
Systemwide, the number of permanent staff new hires increased slightly from 2011 to 2015, with larger increases at UTC and UTIA.
|
2011 |
2012 |
2013 |
2014 |
2015 |
2016 |
| UT System Total |
501 |
483 |
540 |
824 |
835 |
1,036 |
| UT Knoxville |
211 |
230 |
240 |
401 |
409 |
470 |
| UT Chattanooga |
57 |
45 |
52 |
76 |
92 |
101 |
| UT Martin |
29 |
29 |
36 |
42 |
40 |
72 |
| UT Health Science Center |
125 |
123 |
163 |
223 |
202 |
212 |
| UT Institute of Agriculture |
78 |
52 |
44 |
71 |
107 |
165 |
| UT Institute for Public Service |
1 |
4 |
5 |
11 |
8 |
16 |
| Definition |
Data Source |
| Represents the total number of paid, regular (permanent) staff (all EEO codes but 21-26) who were classified as new hires from Nov. 1 to Oct. 31 of year reported. | IRIS Human Resource Business Warehouse Report |
Back to top »
Goal 4. Improving Effectiveness & Efficiency
Human Resources
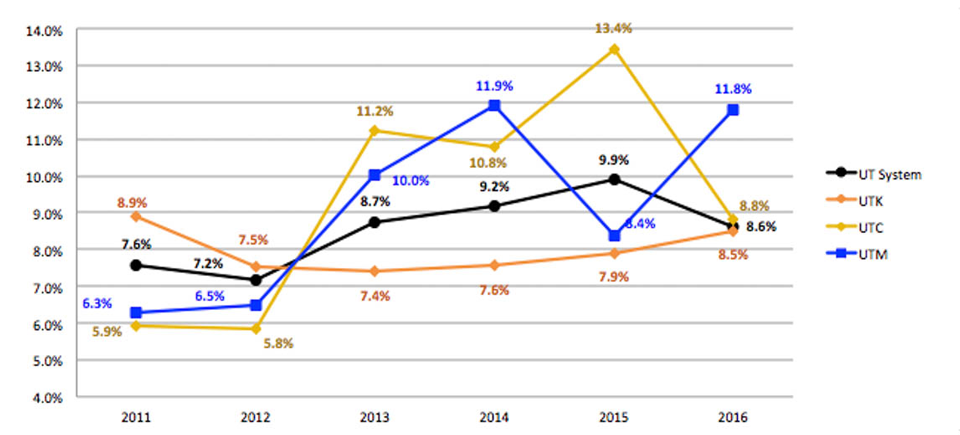
Turnover Rate - Permanent Faculty (%)
Systemwide, faculty turnover rates have ranged between 7.2% to 9.9% with greater flucations at the campuses. Recent increases at UTC and UTM are related to early retirement incentive programs.
|
2011 |
2012 |
2013 |
2014 |
2015 |
2016 |
| UT System Average |
7.6% |
7.2% |
8.7% |
9.2% |
9.9% |
8.6% |
| UT Knoxville |
8.9% |
7.5% |
7.4% |
7.6% |
7.9% |
8.5% |
| UT Chattanooga |
5.9% |
5.8% |
11.2% |
10.8% |
13.5% |
8.8% |
| UT Martin |
6.3% |
6.5% |
10.0% |
11.9% |
8.4% |
11.8% |
| UT Health Science Center |
7.3% |
8.0% |
9.3% |
11.3% |
11.9% |
8.9% |
| UT Institute of Agriculture |
6.3% |
6.0% |
8.2% |
5.7% |
10.2% |
4.6% |
| Definition |
Data Source |
| Represents the total number of full-time, regular (permanent) faculty (EEO codes 21-26) who were classified in IRIS as terminations from Nov. 1 to Oct. 31 of year reported. Does not include transfers to other UT departments. | IRIS Human Resource Business Warehouse Report |
Back to top »
Goal 4. Improving Effectiveness & Efficiency
Human Resources
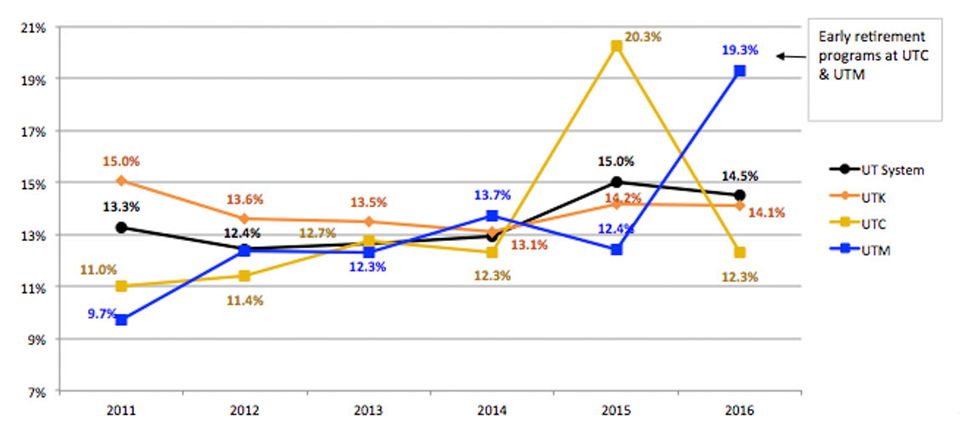
Turnover Rate - Permanent Staff (%)
Staff turnover rates have typically fluctuated between 11-14%. Recent increases at UTC and UTM are related to early retirement incentive programs.
|
2011 |
2012 |
2013 |
2014 |
2015 |
2016 |
| UT System |
13.3% |
12.4% |
12.6% |
12.9% |
15.0% |
14.5% |
| UT Knoxville |
15.0% |
13.6% |
13.5% |
13.1% |
14.2% |
14.1% |
| UT Chattanooga |
11.0% |
11.4% |
12.7% |
12.3% |
20.3% |
12.3% |
| UT Martin |
9.7% |
12.4% |
12.3% |
13.7% |
12.5% |
19.3% |
| UT Health Science Center |
13.2% |
12.1% |
13.4% |
14.6% |
19.2% |
18.1% |
| UT Institute of Agriculture |
11.3% |
8.4% |
8.9% |
10.5% |
10.8% |
12.0% |
| UT Institute for Public Service |
9.2% |
7.6% |
12.6% |
10.9% |
14.8% |
7.5% |
| Definition |
Data Source |
| Represents the total number of full-time, regular (permanent) staff who were classified in IRIS as Terminations from November 1 to October 31 of year reported. Does not include Transfers to other UT departments. | IRIS Human Resource Business Warehouse Report |
Back to top »
Goal 4. Improving Effectiveness & Efficiency
Human Resources
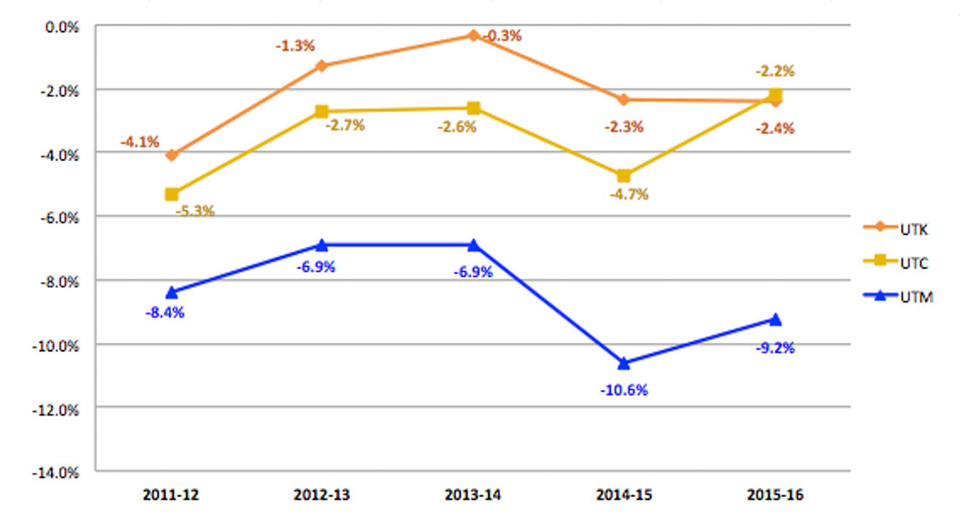
Salaries (% below market) - Faculty Compensation
In FY2016, the average professor salaries at UT campuses remained below their respective peer averages, but have narrowed the gap slightly from last year at UTC and UTM. UTM is 9.2% below their peer average compared to 2.2% for UTC and 2.4% for UTK.
|
2011-12 |
2012-13 |
2013-14 |
2014-15 |
2015-16 |
| UT Knoxville |
-4.1% |
-1.3% |
-0.3% |
-2.3% |
-2.4% |
| UT Chattanooga |
-5.3% |
-2.7% |
-2.6% |
-4.7% |
-2.2% |
| UT Martin |
-8.4% |
-8.0% |
-7.9% |
-10.6% |
-9.2% |
| Definition |
Data Source |
| Average annual salary of Professor ranks (Professor, Associate Professor, Assistant Professor) as reported to IPEDS. Campus salary average is compared as a percentage above or below its THEC-assigned set of peer institutions' faculty salary average. |
Integrated Post-Secondary Educational Data System (IPEDS). |
Back to top »
Goal 4. Ensuring Effectiveness and Efficiency
Affordability
In-State Undergraduate Mandatory Tuition & Fees vs. Peer Group
In 2015-16, UT Knoxville charged higher in-state undergraduate tuition and mandatory fees than their peers, while UT Chattanooga and UT Martin remained below their peer average.
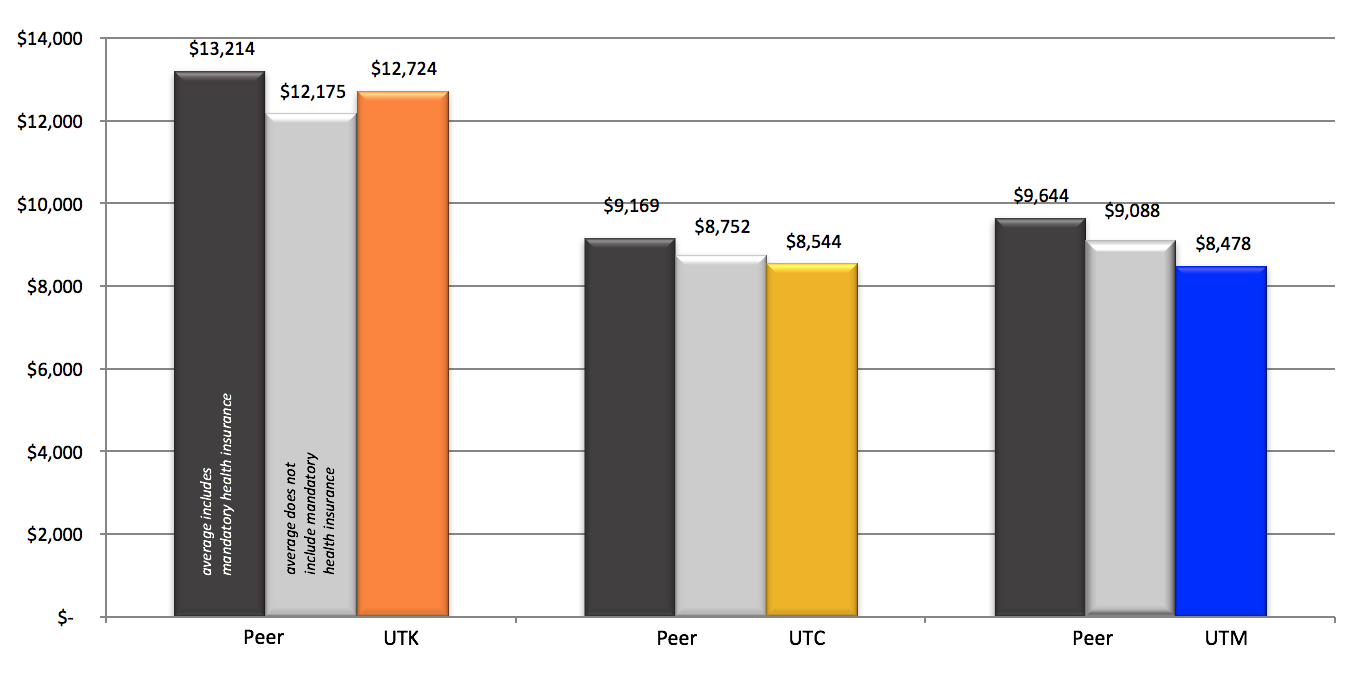
| 2016 – 2017 |
UTK |
UTC |
UTM |
| Peer with Insurance |
$13,214 |
$9,169 |
$9,644 |
| Peer without Insurance |
$12,175 |
$8,752 |
$9,088 |
| UT Institution |
$12,724 |
$8,544 |
$8,478 |
| % Difference |
104.5% |
97.6% |
93.3% |
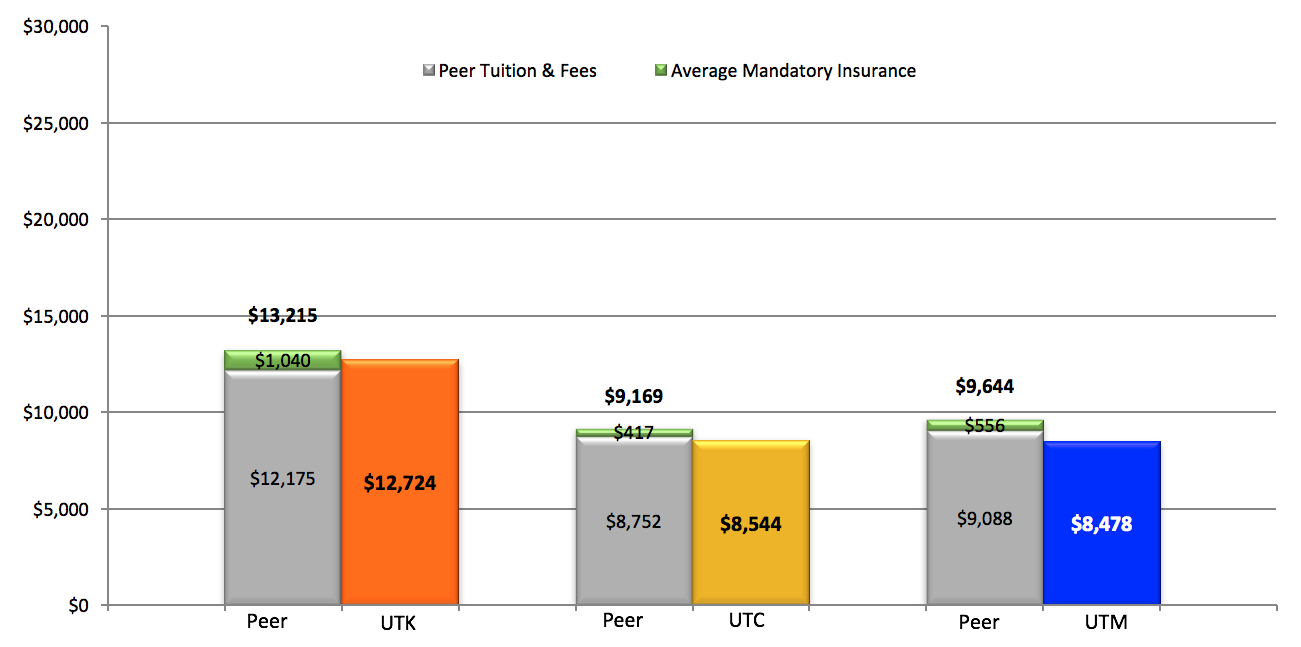
| 2016 – 2017 |
Peer UTK |
UTK |
Peer UTC |
UTC |
Peer UTM |
UTM |
| Peer Average |
|
|
|
|
|
|
| Peer Tuition and Fees |
$12,175 |
|
$8,752 |
|
$9,088 |
|
| Average Mandatory Insurance |
$1,040 |
|
$417 |
|
$556 |
|
| Total |
$13,215 |
|
$9,169 |
|
$9,644 |
|
| |
|
|
|
|
|
|
| UT Institution Tuition & Fees |
|
$12,724 |
|
$8,544 |
|
$8,478 |
| Definition |
Data Source |
| Total in-state tuition and mandatory fees for a full-time undergraduate. Peer groups include Top 25 for UTK, Gap peers for UTC, and THEC peers for UTM. |
Campus Websites |
Back to top »
Goal 4. Ensuring Effectiveness and Efficiency
Affordability
Net Cost of Tuition & Mandatory Fees for Undergraduates
Actual net cost of tuition and mandatory fees are significantly less than tuition and fee rates when factoring in scholarships and grants. However, there has been a steady increase in Net Cost of tuition and mandatory fees.
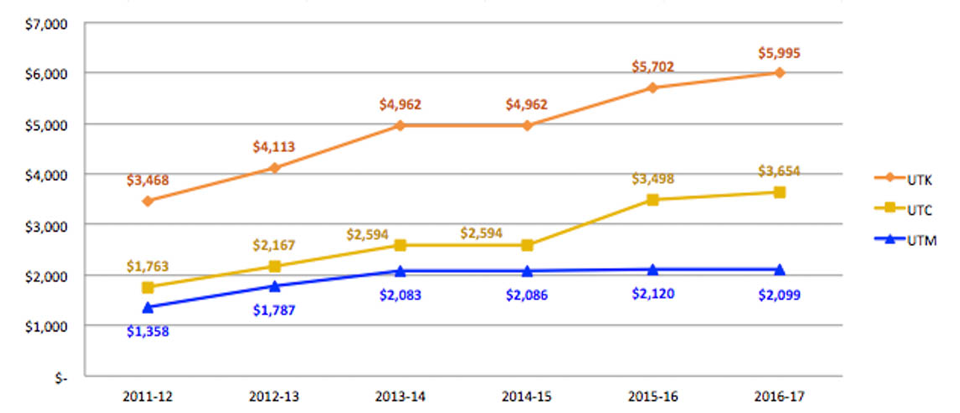
| |
2011-12 |
2012-13 |
2013-14 |
2014-15 |
2015-16 |
2016-17 |
| UT Knoxville |
$2,910 |
$3,468 |
$4,113 |
$4,962 |
$5,702 |
$5,995 |
| UT Chattanooga |
$1,314 |
$1,763 |
$2,167 |
$2,594 |
$3,498 |
$3,654 |
| UT Martin |
$1,358 |
$1,787 |
$2,083 |
$2,086 |
$4,163 |
$2,099 |
| Definition |
Data Source |
| The average amount an in-state full-time undergraduate student pays in tuition and mandatory fees after subtracting the average amount for scholarships and grants. | Campus Financial Aid Offices |
Back to top »
Goal 4. Ensuring Effectiveness and Efficiency
Affordability
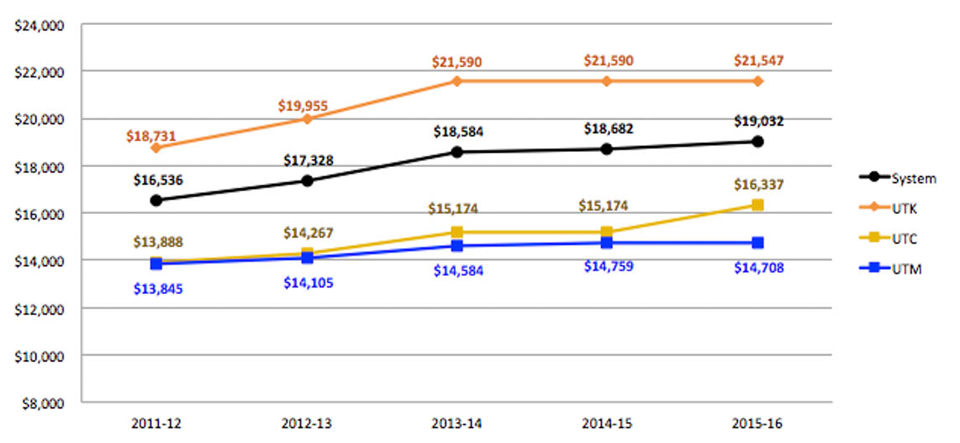
Net Cost of Attendance for Undergraduates
The net cost of attendance for undergraduates has remained frailriy stable since FY2013-14 but has increased 14% systemwide over the past 5 years.
| |
2011-12 |
2012-13 |
2013-14 |
2014-15 |
2015-16 |
2016-17 |
| UT System |
$16,536 |
$17,328 |
$18,584 |
$18,682 |
$19,032 |
$19,727 |
| UT Knoxville |
$18,731 |
$19,955 |
$21,590 |
$21,590 |
$21,547 |
$22,161 |
| UT Chattanooga |
$13,888 |
$14,267 |
$15,174 |
$15,174 |
$16,337 |
$16,928 |
| UT Martin |
$13,845 |
$14,105 |
$14,584 |
$14,759 |
$14,708 |
$15,680 |
| Definition |
Data Source |
| The average amount an in-state full-time undergraduate student pays in tuition and mandatory fees after subtracting the average amount for scholarships and grants. | Campus Financial Aid Offices |
Back to top »
Goal 4. Ensuring Effectiveness and Efficiency
Affordability
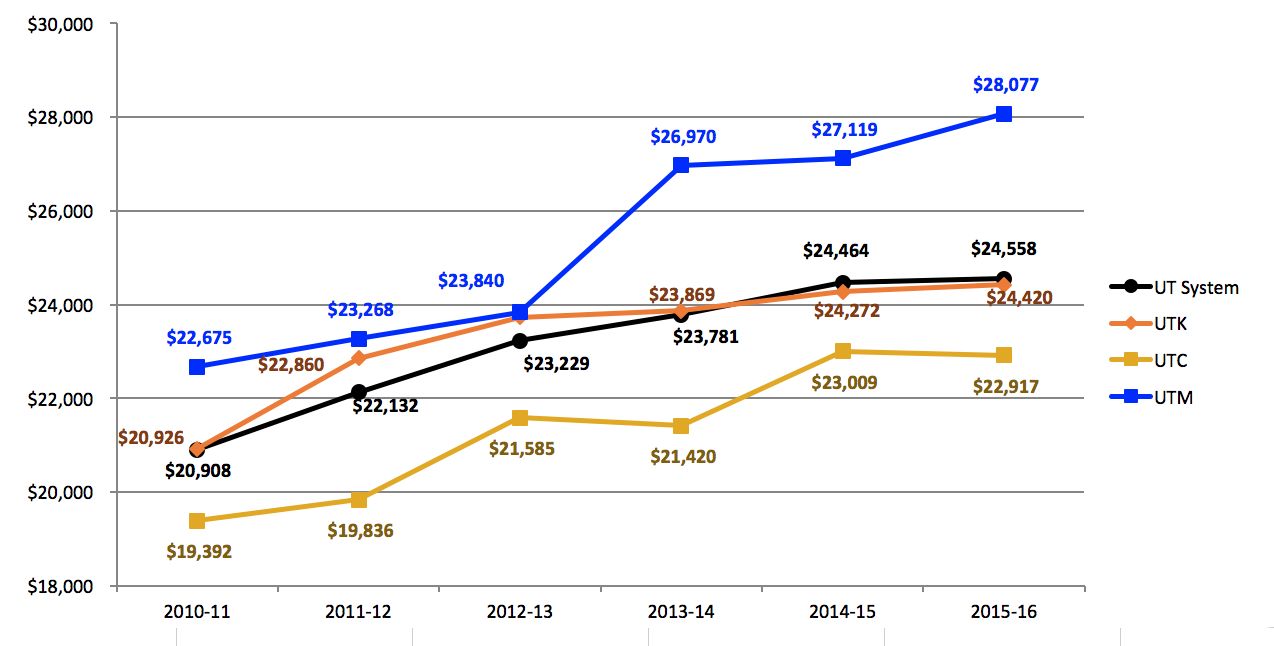
Level of Undergraduate Student Indebtedness
Systemwide, the average level of undergraduate student debt at graduation has increased by about 17% from AY2011 to FY2015.
| |
2010-11 |
2011-12 |
2012-13 |
2013-14 |
2014-15 |
2015-16 |
| UT System |
$20,908 |
$22,132 |
$23,229 |
$23,781 |
$24,464 |
$24,558 |
| UT Knoxville |
$20,926 |
$22,860 |
$23,728 |
$23,869 |
$24,272 |
$24,420 |
| UT Chattanooga |
$19,392 |
$19,836 |
$21,585 |
$21,420 |
$23,009 |
$22,917 |
| UT Martin |
$22,675 |
$23,268 |
$23,840 |
$26,970 |
$27,119 |
$28,077 |
| Definition |
Data Source |
| The average amount of debt a student has accumulated at the time of graduation for those who have taken out student loans. This does not include loans taken out by parents to help pay their student's college expenses. | Common Data Set reported on Campus Websites |
Back to top »
Goal 4. Ensuring Effectiveness and Efficiency
Affordability
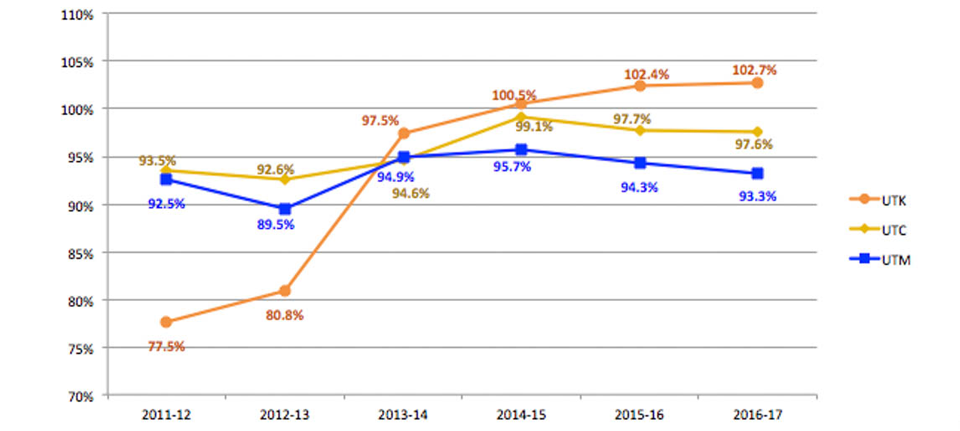
Tuition as Percent Of Peer Average
UT Martin and UT Chattanooga have had slight trends downwards since 2014-15, while UT Knoxville has been steadily climbing, with a sharp increase with the implementation of the 15-4 tuition model in 2013-14.
| |
2011-12 |
2012-13 |
2013-14 |
2014-15 |
2015-16 |
2016-17 |
| UT Knoxville |
77.6% |
80.8% |
97.5% |
100.5% |
102.4% |
102.7% |
| UT Chattanooga |
93.5% |
92.6% |
94.6% |
99.1% |
97.7% |
97.6% |
| UT Martin |
92.5% |
89.5% |
94.9% |
95.7% |
94.3% |
93.3% |
| UT System Average |
84.4% |
85.4% |
95.9% |
98.8% |
99.1% |
98.9% |
| Definition |
Data Source |
| The average amount an in-state full-time undergraduate student pays in tuition and mandatory fees as compared to peer institutions.
| Common Data Set reported on Campus Websites |
Back to top »